| |
Drift length of TPC: 15 cm
Double GEM tower, spacing:
Voltages: 5220 V (drift); 3150 V (GEM)
Drift field: 138 V/cm
| Gas |
ArCO2 (90/10) |
P10 ArCH4 (90/10) |
| drift velocity (cm / musec) |
0.89 |
5.5 |
| transverse diffusion (mm / sqrt(cm)) |
0.23 |
0.56 |
| longitudinal diffusion (mm / sqrt(cm)) |
0.24 |
0.37 |
| data runs |
1010 - 1035 |
1100 - 1155 |
| number of good events |
. |
. |
Data taken July 18 to Nov 28, 2002
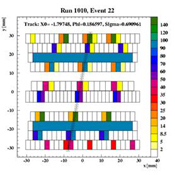 |
Event display
192 pads, 64 readout channels
Rows 1, 2, 4, 7, 9, 10: 2.54 mm x 5.08 mm; used for
track determination.
Row 5: 2.032 mm x 6.096 mm; used for resolution studies.
Row 6: 3.048 mm x 5.080 mm; used for resolution studies.
Rows 3, 8; used for filtering. |
Run 1010, Event 22
pulses of the three channels with hits in row 7. See event display above.
|
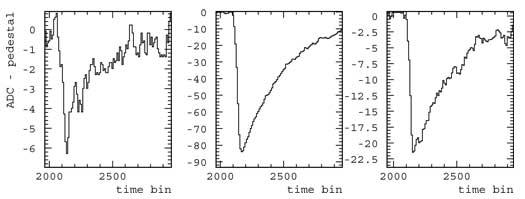
The amplitude of a pulse is
determined in 4 steps:
1) Tmax is the timebin with maximum pulse.
2) amplitude(Tmax)
is determined from average between timebins Tmax+50
and Tmax+350. If the pulse is late the
window is decreased down to a minimum
of 100 time bins.
3) find T0 as pulse(T0)
= amplitude(Tmax)/2 from a window of 25 timebins.
4)
correct amplitude(Tmax) to amplitude(T0) with average
fall time.
|
 |
 |
Calibration
distributions
mean pedestal:
changes from channel to channel but very consistent
from run to run.
mean amplitude:
channel 13 shows low amplitude. It is a bit noisy
and empty events are included in the mean.
channels 24 and 39 are filter pads of rows 3 and
8.
channels 16 and 48 are veto channels (8* multiplexed).
|
 |
 |
mean
rise time:
depends on the drift distance (diffusion), not used in the analysis.
mean fall time:
determined by electronics, consistent from run to run. |
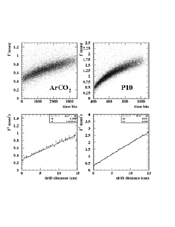
| Mean amplitude as
function of run number for 3 regions of Drift Distance |
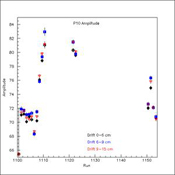 |
P10
No cuts besides the groupings of drift distance.
The amplitude of the signal seen by the pads
does not greatly depend on drift distance. |
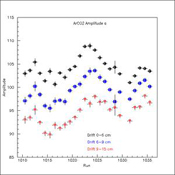 |
ArCO_2
Good data set for ArCO2
No cuts besides the groupings of drift distance.
For ArCO2 there is a loss of amplitude for larger drift distances. |
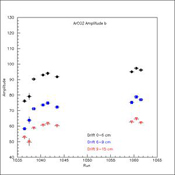 |
ArCO_2
Bad data set for ArCO2
No cuts besides the groupings of drift distance. |
Noise
P10 |
ArCO2 |
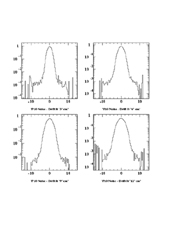
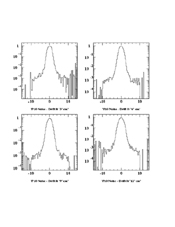
After demultiplexing; amplitudes are
normalised to total amplitude of a row = 1.
Shown is the mean amplitude (incl. pads with 0 amplitude) as function of distance
to track for 4 regions of drift distance. Usual amplitude reconstruction, e.g.
amplitudes less than 2 are set to 0.
The pedestal gives the noise level to be included in the fit. |
Amplitude Distributions
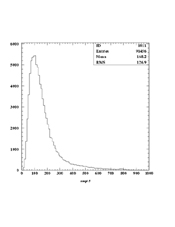
ArCO2 |
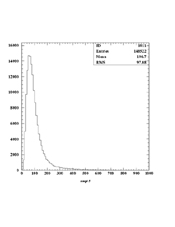
P10 |
Cuts: |phi| < 5 deg & |theta| < 5
deg |
Track Width
|
Fits
for different noise levels and cuts |
| |
ArCO2 |
P10 |
| Noise |
s0 |
slope |
s0 |
slope |
| 0.1% |
0.3195+-0.0072 |
0.0432+-0.0010 |
0.3368+-0.0071 |
0.1843+-0.0009 |
| 0.2% |
0.2961+-0.0066 |
0.0438+-0.0009 |
0.3175+-0.0067 |
0.1838+-0.0008 |
| 0.5% |
0.2599+-0.0062 |
0.0441+-0.0009 |
0.2996+-0.0064 |
0.1788+-0.0008 |
| 0.2% |
|theta| < 7 |
| |
0.2849+-0.0082 |
0.0422+-0.0010 |
0.2809+-0.0077 |
0.1863+-0.0010 |
| 0.2% |
|phi| < 7 |
| |
0.2433+-0.0055 |
0.0479+-0.0009 |
0.2433+-0.0065 |
0.1929+-0.0010 |
Updated: 23 Sept. 2003
ArCO2, 0.1% was in fact 0.5%; all old results from
partial statistics
Cut: |x0fit|<50 => reasonable trackfit
Mean
track width for drift distances |
P10 |
|
ArCO2 |
drift 0-3 cm: 0.7007 mm
drift 3-8 cm: 1.120 mm
drift
> 8 cm: 1.524 mm
|
|
drift 0-3 cm: 0.4911 mm
drift 3-8 cm: 0.6372 mm
drift > 8 cm: 0.7796 mm
|
|
<Previous Page | Next Page>
Top | Back
to Index |
|