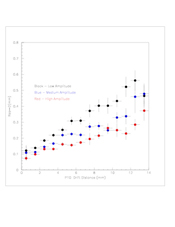
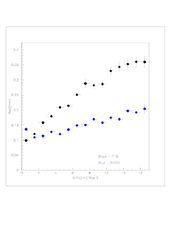
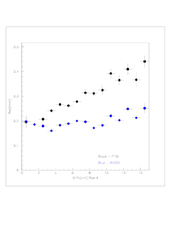
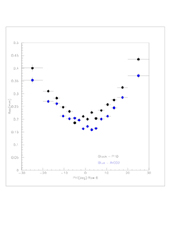
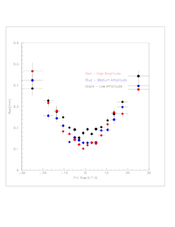
X Resolution as Function of Drift Distance
Cuts: |theta| < 7,
|phi| < 5
Resolution2 vs. Drift for 3 Amplitudes
Row 5
P10 |
ArCO 2 |
For P10 the amplitude ranges are:
Low: 0 - 60
Medium: 60 - 100
High:> 100
|
For ArCO2 the amplitude ranges are: ????
Low: 0 - 100
Medium: 100 - 170
High: > 170 |
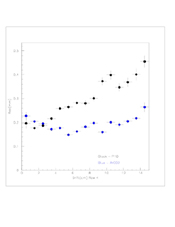
Linear Fits for P10
| Amplitude |
Equation |
| Low |
0.0149x - 0.00563 |
| Medium |
0.00765x - 0.00132 |
| High |
0.00361x + 0.00096 |
|
Linear Fits for ArCO2
| Amplitude |
Equation |
| Low |
0.00250x - 0.01279 |
| Medium |
0.00146x - 0.00452 |
| High |
0.0.00051x + 0.00645 |
|
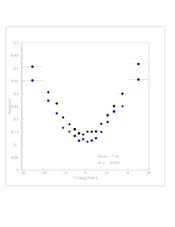
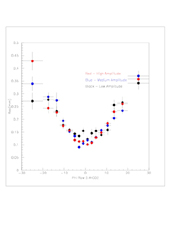
Resolution vs. Drift
These plots are the same as the ones above, but not linearised.
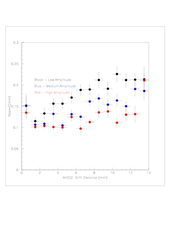
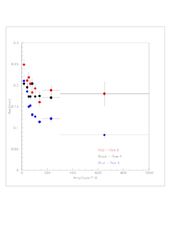
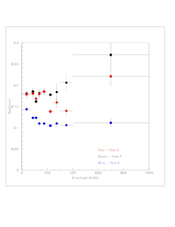
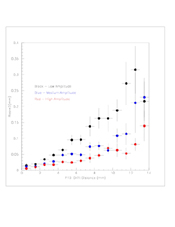
X Resolution as Function of Amplitude
Each point contains approximately the same number of events.
See amplitude distribution
plot below.
Cuts: |phi| < 5, drift < 3
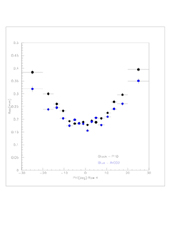
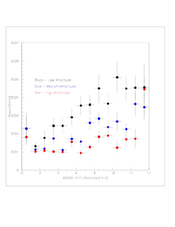
X Resolution as Function of phi
Resolution depending on phi. A higher (absolute) angle increases the track
angle effects and reduces resolution.
Track angle effect is smaller for wide pads since resolution improves with angle
in the center of the pad
Cuts: drift < 3 cm
Fit results |
| Gas - Row |
sig_fix |
Neff |
phi_0 |
| P10 - row 4 |
0.1775 |
5.004 |
0.2320 |
| P10 - row 5 |
0.1412 |
4.009 |
0.04758 |
| P10 - row 6 |
0.1984 |
4.480 |
0.6939 |
| ArCO2 - row 4 |
0.1724 |
7.682 |
0.6743 |
| ArCO2 - row 5 |
0.1120 |
5.192 |
0.06879 |
| ArCO2 - row 6 |
0.1685 |
5.641 |
-0.2943 |
Phi plots were fit to the function:sig(phi) = sqrt[sig_fix^2 + L^2*tan((phi+phi_0)^2)/(12*Neff)]
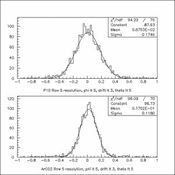
Row 5 in Three Regions of Amplitude
Row 5
P10 |
ArCO2 |
For P10 the amplitude ranges are:
| |
range |
mean |
| Low |
0 - 60 |
42 |
| Medium |
60 - 100 |
78 |
| High |
100 - 1000 |
181 |
|
For ArCO2 the amplitude ranges are:
| |
range |
mean |
| Low |
0 - 150 |
97 |
| Medium |
150 - 250 |
191 |
| High |
250 - 1000 |
383 |
|
Cuts: drift < 3
dfgdfb vfd
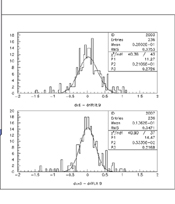
Below are two graphs for ArCO2 that have the same amplitude ranges. The graph
on the left is the old method to determine resolution while the one on the
right is the new method.
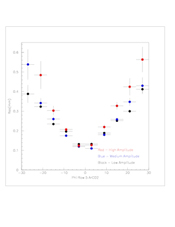 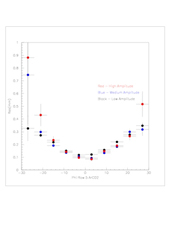
The amplitude ranges are:
Low: 0 - 150
Medium: 150 - 250
High: > 250
Example of X Resolution
 |
Amplitude
Cuts: |phi| < 5 deg; drift < 3 cm; |theta|< 5 deg |
New Resolution Calculation
 |
ArCO2 - Wide pads
Small data set with |phi| < 7 deg
To see all graphs click here
|
Phi for different amplitudes **old analysis
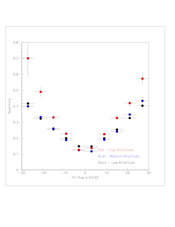 |
ArCO2: Res vs Phi for different amplitude ranges
Fit results:
|
| Amplitude |
sig_fix |
Neff |
phi_0 |
| low: 0-150 |
0.1451 |
3.954 |
2.706 |
| medium: 150-250 |
0.1137 |
3.312 |
2.485 |
| high: >250 |
0.1175 |
1.802 |
2.779 |
black/white |
Summary of Cuts
Last updated
13 August 2003, Dave
<Previous Page | Next Page>
Top | Back
to Index |