| |
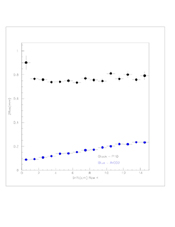
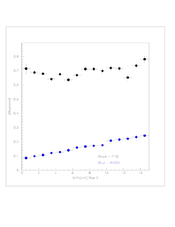
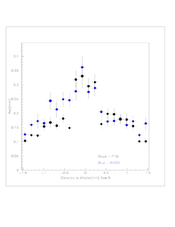
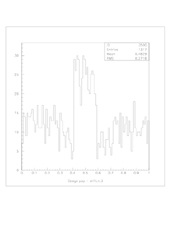
Z Resolution as Function of Drift Distance
Cuts: |phi| < 5
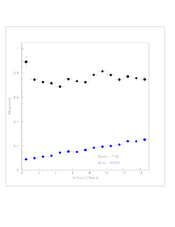
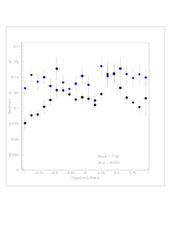
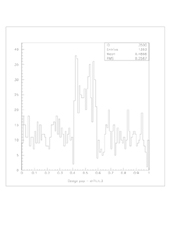
X Resolution as Function of Distance to Edge
These plots show how resolution depends on how far away
the track is from the middle of the pad. Zero on the x
axis corresponds to the middle of the pad.
For ArCO2 (blue) strong effect with wide pads; the resolution decreases rapidly
for tracks more than 1mm from the edge.
For P10 (black) the resolution degrades slowly.
Cuts: |phi| < 5 deg drift < 3 cm
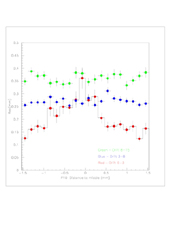
Row 6 (Wide Pads) only; Three Regions of Drift Distances
|
|
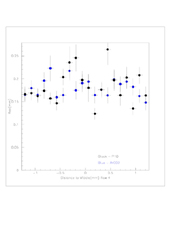
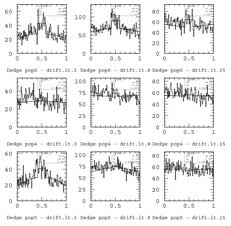
| Cuts: |phi| < 5 |
P10 |
ArCO2 |
These
plots show the distribution of x position calculated
using data from row 6 only. In this case the center
of the pad is 0.5.
Cuts are |phi| < 5,
amplitude < 50 (P10) or amplitude < 100 (ArCO2)
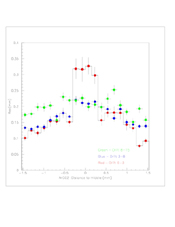
|
Reconstructed position of hits across
pads (edge at 0 and 1, center at 0.5).
3 regions of drift distance, pad width: row 5: 2 mm;
row 4: 2.5 mm; row 6: 3 mm.
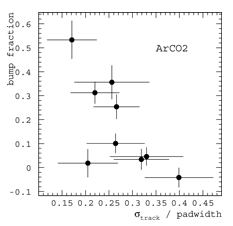
Fitted with a polynomial a0+a2*(x-0.5)**2 + bumpfraction*a0 in the center.
|
<Previous
Page | Next Page>
Top | Back
to Index |
|