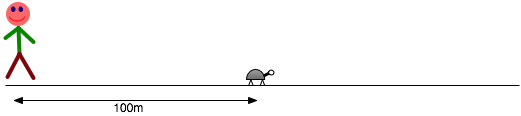
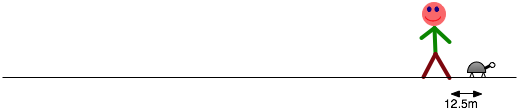
e.g. "Achilles and the tortoise ": he wants to catch a tortoise that is 100 m away. He runs twice as fast. Can he catch it?
So does he catch it?
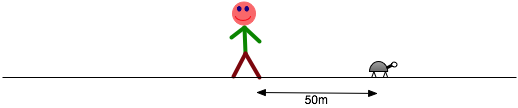
We have an infinite series of moves
1
1 + 1/2 = 1.5
1 + 1/2 + 1/4 = 1.75
1 + 1/2 + 1/4 + 1/8 = 1.875
1 + 1/2 + 1/4 + 1/8 + 1/16 .......= 2
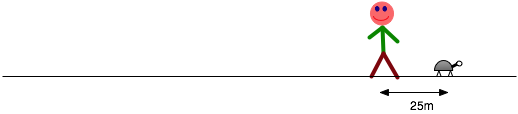
So we asked the wrong question: not how many moves does he take, but how far does he have to go.
Infinite series can have a finite sum!
Speed and Velocity
Average Speed is just distance/time
Speed =  d
       (t1-t0)
e.g. if Achilles runs d=100m starting at 4.00.00 p.m. and ending at 4.00.20 p.m., then
speed = 100  = 5 ms-1
      (20-0)
Displacement is the distance that you end up away from the starting point (Not the total distance travelled)
Velocity is Displacement/time
Displacement and Distance
e.g. A car travels in a triangular loop as shown:
What is its speed and velocity if it takes one hour?
Speed =distance/time =70 km/1hr=70 km/hr-1
Velocity = displacement/time = 0 (since it ended up at the same position)
Constant Acceleration
e.g. A car travelling between traffic lights.
Lights are 25 m apart, and the car takes 10 s to travel between them, by accelerating to start with and then braking at the same rate.
.
How does its position vary with time?
How does its velocity vary with time?
How does its acceleration vary with time?
Distance-Time plot
Note that car starts slowly: position plot draws out a smooth curve
Av. Vel. (0-10 s) = Tot. Dist.  = 25
                    Tot. Time     10
 = 2.5 ms-1
Suppose we take a 4 s time window
Av. Vel. (4-8 s) = Tot. Dist.  = 14
                   Tot. Time     4
= 3.5 ms-1
Suppose we take a 2 s time window
Av. Vel. (4-6 s) = Tot. Dist.  = 9
                   Tot. Time     2
 = 4.5 ms-1
Instantaneous Velocity
Av. Vel. over short time => Instantaneous vel. = slope of dist/time curve
By measuring the slope at each point, we can get the velocity time curve.
x2-x1 = δx --> dx  = v
t2-t1   δt     dt
when the time difference
t2-t1 = δt = dt
becomes very short
Instantaneous Velocity
Instantaneous vel. = slope of dist/time curve
= 5 ms-1 at t = 5 s
Velocity-Time plot
By measuring the slope at each point, we can get the velocity time curve.
Acceleration-Time plot
Acceleration
$$
\color{red}{
a = \frac{{{\text{change in velocity}}}}{{{\text{change in time}}}} = \frac{{v_1 - v_0 }}{{t_1 - t_0 }}}
$$
This is easy for the case we are considering...
$$
\color{red}{
a = \frac{{{\text{change in velocity}}}}{{{\text{change in time}}}} = \frac{{v_1 - v_0 }}{{t_1 - t_0 }}}
$$ is 1 ms-2
Acceleration
For 0<t<5
a = 5/5 = 1 ms-1 i.e. or any time t < 5s, the accn is the same:
(note the Greeks had no concept of accn.)
Constant Acceleration
Often a very good approximation
$$
\color{red}{
a = \frac{{{\text{change in velocity}}}}{{{\text{change in time}}}} = \frac{{v_1 - v_0 }}{{t_1 - t_0 }}}
$$
If we start the clock at t0=0, when the velocity is v0, then this can be written
$$
\color{red}{
a = \frac{{v - v_0 }}{t}}
$$
or
$$
\color{red}{
v = v_0 + at}
$$
i.e. vel at time t = starting vel + accn*time
Similarly, we get the average velocity
$$
\color{red}{
\bar v = \frac{{v + v_0 }}{2}}
$$
but this is also total distance/time = s/t
Hence
\color{red}{
\frac{s}{t} = \frac{{v_0 + at + v_0 }}{2}}
which can be re-arranged
$$
\color{red}{
s = \bar vt = \left( {\frac{{v_0 + at + v_0 }}{2}} \right)t = v_0 t + \frac{1}{2}at^2 }
$$
v-s
Finally we can combine eliminate time from these two equations
\color{red}{
\begin{array}{l}
s = v_0 t + \frac{1}{2}at^2 \\
t = \frac{{v - v_0 }}{a} \\
\end{array}}
\color{red}{
\begin{array}{l}
v = v_0 + at \\
s = v_0 t + \frac{1}{2}at^2 \\
v^2 = v_0 ^2 + 2as \\
\end{array}}
These only apply if the Acceleration is constant: do not use otherwise!
This method of plotting distance-time velocity-time and acceleration time graphs is very useful for visualising how the three quantities relate.e.g. a Hockey Puck
A hockey puck is struck at one end of the ice, slides down to the other, rebounds and comes to a stop in the middle of the ice. Which of the following plots most accurately describes its displacement as a function of time?
A hockey puck is struck at one end of the ice, slides down to the other, rebounds and comes to a stop in the middle of the ice. Which of the following plots most accurately describes its velocity as a function of time?
A hockey puck is struck at one end of the ice, slides down to the other, rebounds and comes to a stop in the middle of the ice. Which of the following plots most accurately describes its acceleration as a function of time?
Gravitation
A very important example of this is the acceleration due to gravity. To a good
approximation, all objects falling near the Earth's surface have the same acceleration
a = -g where g = 9.8 ms-2
Note that we define directions so that upwards is positive.
How are grav. accn. and velocity connected?
A ball is thrown up in the air. During the first part of its motion (before it reaches its maximum height)
the velocity and the acceleration are both upward.
the velocity and the acceleration are both downward.
the velocity is upward and the acceleration is downward.
the velocity is downwards , and the acceleration is upward.