TPC Simulation Package
Version 1.0 Alpha (May 2002)
Program description
A java package, tpcsimulator, simulates ionization, electron transport, signal generation, and track fitting in a time projection chamber (TPC). The package is designed to help optimize the design of such a device, in particular for its application in a future linear collider experiment. The program can be used to interactively build a TPC and examine its response to ionizing radiation. Any arrangement of pads of any shape can be specified and the tracking performance of the design can be evaluated. Monte Carlo raw data files can be produced for analysis by external programs. The TPC design can be saved for later use or for large Monte Carlo event generation done in batch mode. Ntuples of tracking information can be saved in "AIDA" format.Requirements
The program should run under any operating system that has installed the SUN Java Run Time Environment version 1.3 and above. To check the version of java installed on your system, execute:java -versionYou can download the most recent Java Platform here.
Download
Download the following java archive files:- tpcs.jar ( tpcsimulator software. This includes the Nonlinear Optimization Java Package translated to java by Steve Verrill.)
- jas.jar (from the Java Analysis Studio [Tony Johnson, SLAC], which is used to display histograms)
- aida.jar (specification of the AIDA interfaces)
- freehep-hep.jar (base java AIDA implementation)
- freehep-base.jar (utilities used by freehep-hep)
- xerces.jar (for saving and restoring XML files)
- jtpc.jar (The java tpc simulation and analysis package. This is under development, and contains a new version of tpcsimulator. You can use this in place of tpcs.jar. Current version: August 14, 2002)
Running the program
Method (A)
The best way to run the program is include all the jar files in your CLASSPATH. To execute, just type:java tpcsimulator.Interactive
Method (B)
If you don't know how to (or don't want to) change your CLASSPATH, then you can specify all this on the command line. Place the files into a single directory. To run the interactive program, cd to that directory and execute the following on a single line:java -cp tpcs.jar;jas.jar;aida.jar;freehep-hep.jar;freehep-base.jar;xerces.jar tpcsimulator.Interactive*** Note: on Unix systems replace the semi-colons with colons ***
Documentation
There is no online help provided. The following describes the functionality of the program.Creating a TPC
When the program starts a default TPC is created. You can make modifications to it, start from scratch, or load in a previously created TPC. To do any of these, choose TPC from the menu bar: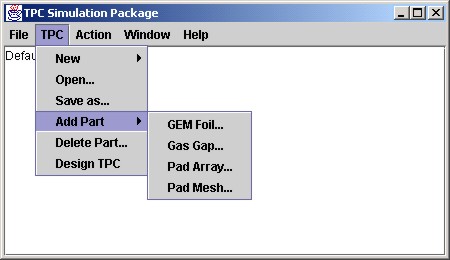
The TPC is constructed as layers of elements, one on top of each other. Generally it consists of a gas volume (called a Gas Gap) followed by some GEM foils separated by other Gas Gaps and an arrangement of readout pads at the bottom. There are two types of readout pads to choose from. A pad array is for a regular arrangement of simply shaped pads. A pad mesh allows any arrangement of arbitrarily shaped pads, allows for detailed view of events, and for track fitting. The direction of drifting electrons is from the top of the TPC to the bottom. When a TPC element is added, you assign it a unique name and its location in the stack.
Designing the TPC
The detailed design of the TPC can be examined and modified in the TPC Design window, accessed by selecting "Design TPC" from the TPC Menu. Here is what it looks like when the default TPC has been modified by adding a Pad Mesh and deleting the default Pad Array.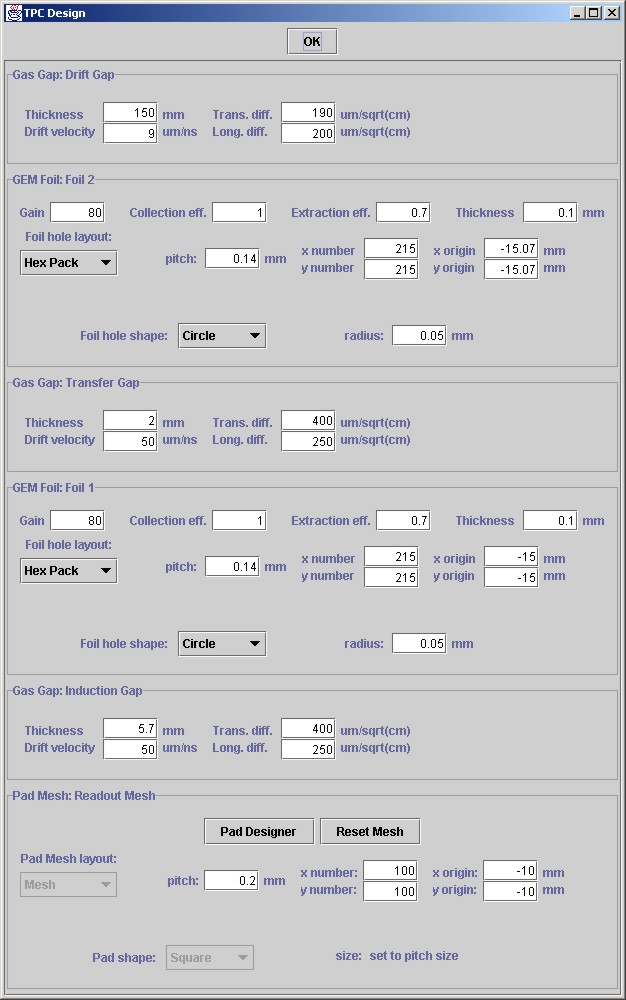
The TPC elements are shown in the correct vertical order, with a small titled frame drawn around each element. The parameters in the white boxes can be modified and the drop down boxes can be selected to change layouts and shapes of foil holes and readout pads.
The bottom element is a pad mesh, a fine grid of square pads that are grouped together to form arbitrarily shaped signal collection regions. Before doing so, it is necessary to specify the number and size of the mesh. If you change these numbers, click on the "Reset Mesh" button to resize the mesh. Then click on "Pad Designer" to define the grouping of pads into "pad groups". The following window will appear:
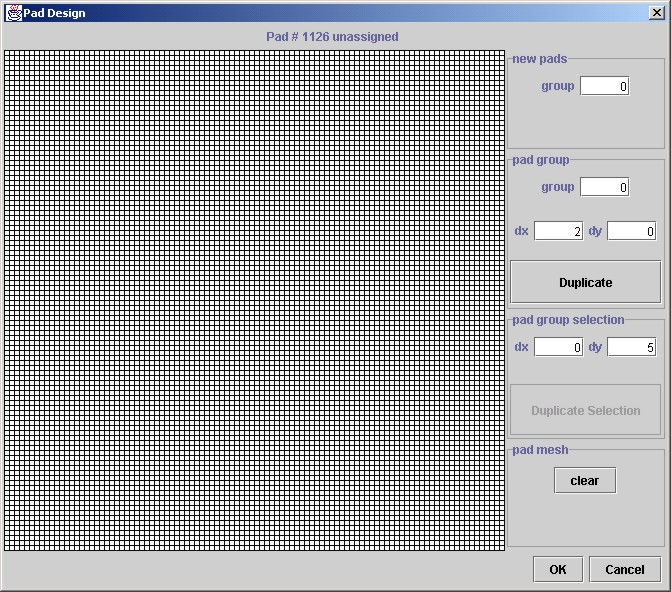
In this example, the mesh is 100 by 100 squares of side length 200 microns. By left-clicking on a square, it will be assigned to the pad-group whose number is indicated on the box on the top right of the window, and will color the pad according to the pad-group number. Left-clicking on the pad again deassigns it. By right-clicking and dragging the mouse, you can paint an area. Existing pad-groups can be copied to form a new pad-group at another location by pressing the duplicate button. The group number automatically updates, so clicking this button several times in a row quickly builds a large number of pad groups in a row or column. Finally, sets of pads can be selected by left-clicking and dragging the mouse over the pads, and they can be duplicated elsewhere on the grid by clicking on the "Duplicate Selection" button. Likewise, repeated clicks of this button will continue the pattern.
Using these buttons it is easy to build a complex pad structure in a few minutes, like the one below:
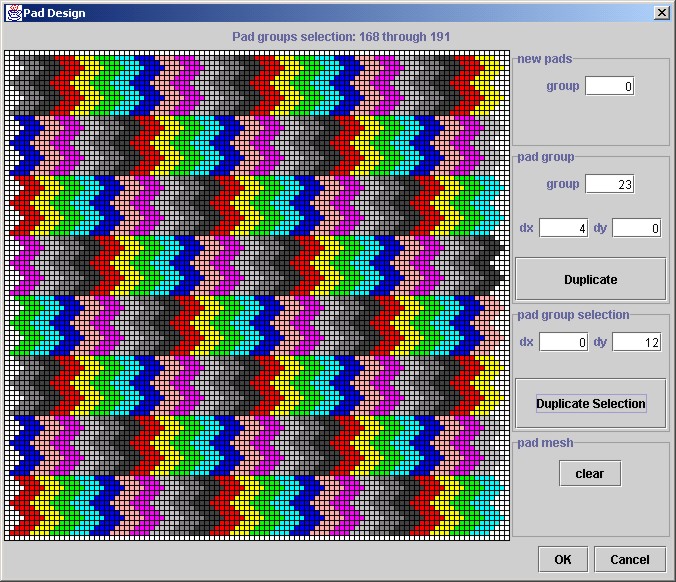
Note that it is a good idea to leave unassigned pads (the white ones) all around the edge of the area. Electrons that drift to the readout plane are collected by the nearest pads to them. If there are electrons outside of the pad area, they will be collected by these unassigned edge pads, and not produce anomalous signals.
Once you are satisfied with the design of the TPC, click OK on the Pad Design window and OK on the TPC Design window. You can save this TPC object in a file by selecting "Save as..." from the TPC menu. The filetype for a TPC object file is .tpc.
Adding electrons to the TPC
Using the Action Menu, you can add an electron cloud, or a track of ionization. The electrons will drift through the gas gaps, multiply in the GEM foils, and leave signals in the readout pads. The signals remain until cleared, which can be performed by selecting "Clear" in the Action Menu. The Action Menu also includes an item to set up (and optionally run) a Monte Carlo job that simulates a cosmic ray experiment, and writes out data from a simulated FADC system to a file for further analysis offline. This is described in more detail below.Examining TPC signals interactively
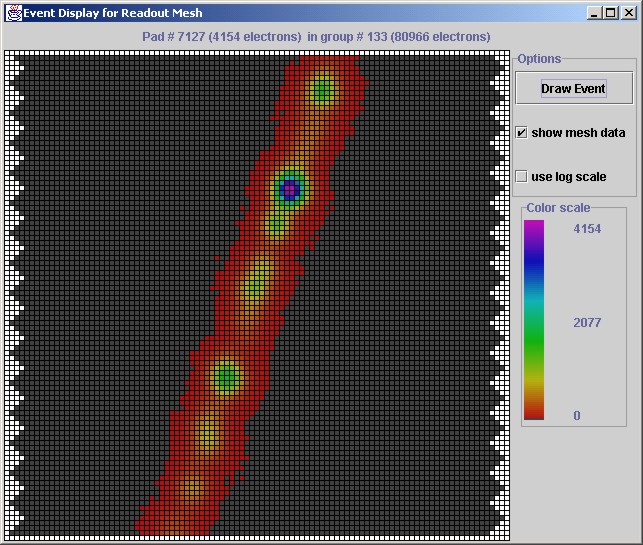
To view an event display from a pad mesh, select "View Window..." under the Window menu, and select the event display window for the mesh of interest. Here is are the event displays at the "pad" and "mesh" levels for a track that was added to the TPC. The first display shows the number of electrons arriving on each of the chevron pads, where the colour scale is indicated on the right. Chevron pad # 133 collected the most electrons (80966). By moving the mouse over the pads, the status line shows the number of electrons in any pad.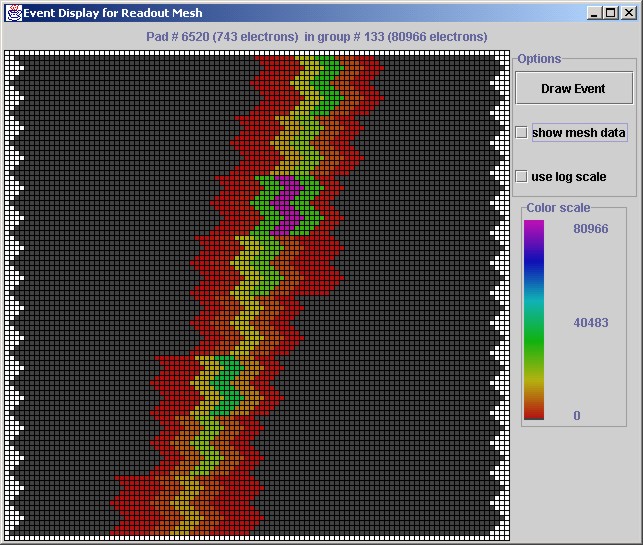
The second event display shows the same event, at the "mesh" level, where the number of electrons collected by each small square is shown. This display is created by clicking on the "show mesh data" box and clicking "Draw Event". The corresponding large ionization is seen more visibly in this view.
To view the time structure of signals on individual pads, select the "electronics" display for the readout mesh, through the "Window" menu. Here is an example of this view.
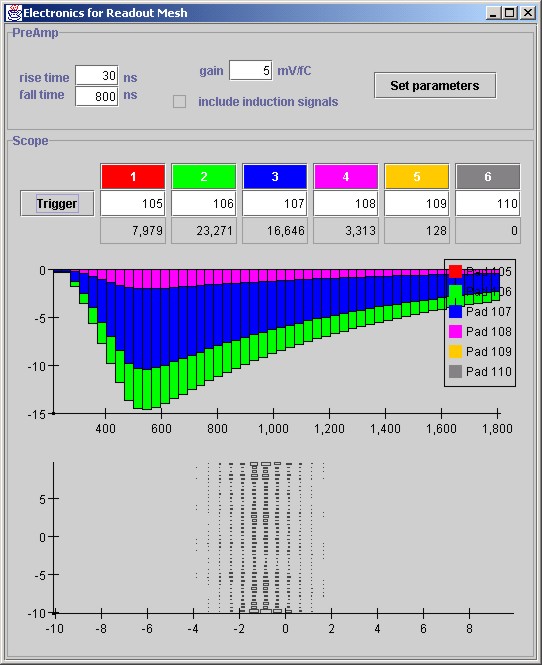
This window simulates the function of an oscilloscope, with the vertical scale in mV and the horizontal scale in ns. The time scale can be adjusted by dragging the mouse on the horizontal axis. Pad groups 105-110 are shown on the scope display, and the number of electrons each pad collected is indicated in the box below the pad numbers. The lower figure is another scatter plot of hits. The example is from an event which has a vertical track only. Pad groups 105-110 are shown on the scope display.
A statistical summary of pad hit counts is available by viewing the "Statistics" window for the readout pads, available under the "window" menu item.
Track Fitting
The data collected by a Pad Mesh can be analyzed by a general purpose XY track fitting algorithm. The purpose is to investigate localized track resolution, and therefore only straight tracks are considered. The algorithm is the one developed in the analysis of GEM/TPC data. Three track parameters are varied to maximize the likelihood of the observed signal fractions on each pad-group row. The model is a Gaussian line charge with the relative signal fractions electrons determined by the multinomial distribution as defined by the primary electron statistics. The method requires the pad-groups to have some row-like order and that there be at least as many rows as free track parameters in the fit. The track parameters consist of
- x0: the track x coordinate at y=0
- phi: the azimuthal angle, measured from the vertical
- sigma: the transverse size of the Gaussian line charge
To perform a fit interactively, open the "Fitter Control" window for the Pad Mesh of interest (found under the "Window" menu). Next, create the fitter by clicking on "set up XY fitter". The fitter will analyze the Pad Mesh and indicate the number of rows it finds. The negative logarithm of the likelihood for specific choices of the track parameters can now be calculated by clicking on the "Calculate Likelihood" button. The minimum of the negative log likelihood is found by clicking on "Do XY track fit". The window below shows the result from fitting to the example track shown above.
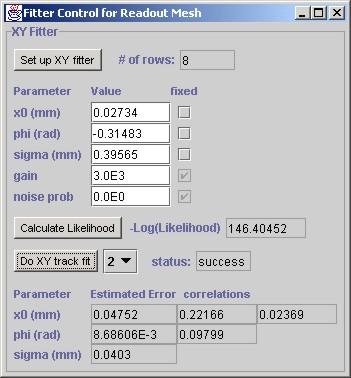
The errors and correlations are determined by the curvature of the negative log likelihood function at its minimum. Therefore this represents only the statistical uncertainty. It will not include the additional variance caused by the non-uniform ionization. For the statistical errors to be valid, it is essential that the effective gain parameter be correctly set, since it is this parameter that converts the number of collected electrons to the primary electron statistics. The effective gain is the product of all the GEM gains and their collection and transfer efficiencies. For the default TPC it is: 80*1*0.7*80*1*0.7 = 3136. The noise prob. parameter refers to a term in the likelihood that allows for noise signals. Since the current simulation does not include noise, this should be left at zero for now.
Monte Carlo Event Generation
To simulate a large number of events with a random minimum ionizing track passing through the TPC device, choose the "Run..." command from the Action Menu. This brings up the window shown below: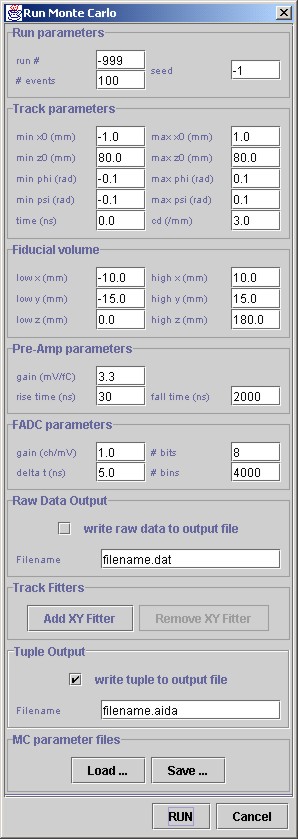
The track parameters x0 and z0 are the x and z coordinates at y=0. Single track events will be generated with random track parameters within the ranges specified. The fiducial volume specifies the active region of the detector. The pre-amp and FADC parameters specify the characteristics of the electronics connected to the bottom readout structure of the TPC.
To create a data file with pulse information, click on the box labelled "write raw data to output file" and provide a filename.
To analyze the data with one or more fitters, click on the "Add XY Fitter" button. It will add a fitter box to this menu in order to specify fitting options. Note that multiple readout structures can be used, with each fit separately. To write the true track parameters and the results from the fitter(s) to a AIDA output file, make sure that the box labelled "write tuple to output file" is checked and enter a filename below. To analyze the AIDA output file, you can use the JAS Tuple Explorer. This program is currently an "early" release. It allows 1D and 2D plots of variables (or combinations of them) with interactive cuts applied, much like PAW.
The set of MC run parameters can be saved to a file (press "Save ...") or read in from an already saved set (press "Load ..."). The file type for the saved parameter set is .tmc. These files are required for Batch operation (see below).
To generate data click on "RUN". The TPC simulator program will be locked until the process ends.
Batch mode MC production
Because the program is simulating the drifting of millions of electrons, it can take a few seconds to generate just one event. To generate large event samples, it may be more conveniently performed in batch mode by using the associated program, tpcsimulator.Batch. The program takes two arguments: the filenames of a previously saved TPC object and a saved MC run parameters (a .tpc and .tmc file, respectively). It is invoked as follows (on one line):java gemsimulator.Batch myTpc.tpc myParams.tmcData from one MC sample is shown below using the TPC analysis program, tpcanal. Note that no noise is included in the signals.
Data structure for MC events
The data structure for the events is shown below. Streaming integers are used.| Item | Size (bytes) | ||||||||||||||||||||
| Identifier ("GEM Simulator MC" in unicode) | 32 | ||||||||||||||||||||
| Version number | 4 | ||||||||||||||||||||
| Run header size | 4 | ||||||||||||||||||||
Run header:
The following repeats for each event: |
40 | ||||||||||||||||||||
| Event header size | 4 | ||||||||||||||||||||
Event header:
|
20 | ||||||||||||||||||||
Event data:
... repeated for each pad Note that the FADC data is a stream of bytes. If |
For more information
If you would like further information on tpcsimulator, or would like to access the java source code, please contact the author, Dean Karlen.
Link to an early study using an old version of gemsimulator is here.