A fourth analysis of 2D GEM position
resolution
Dean Karlen / November 14, 2000
This document summarizes a quick analysis
of the GEM data taken from November 13, 2000. The analysis follows the
general approaches described in the third
analysis.
The goal of this analysis
is to check the data for any serious problems before a careful set of
data is taken for publication. The gas is P10 and the preamps were ALEPH.
The scope time scale was decreased by a factor of 2 compared to the October
data... the data recorded here therefore correspond to 250 MHz sampling.
Index
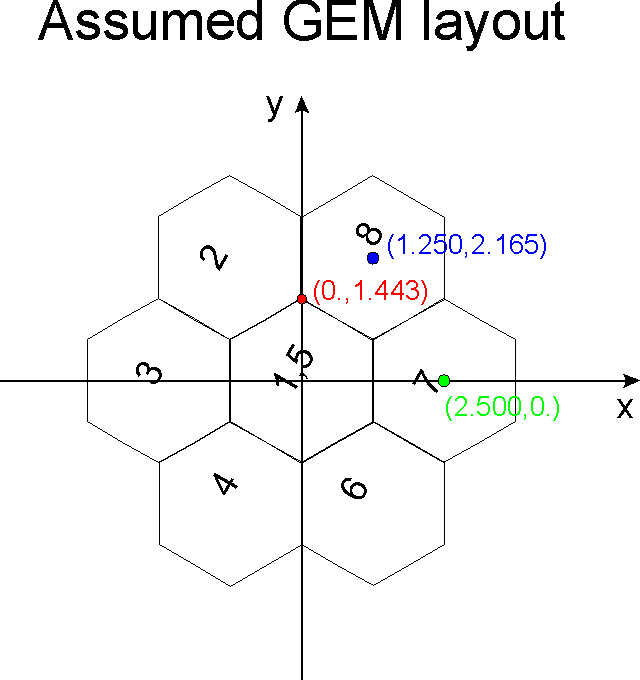
GEM pad layout
The figure linked
here shows the assumed GEM layout and coordinate system. Dimensions are in
mm. The pads are numbered from 1 to 8, according to the readout channel. The
central pad is read out by both oscilloscopes (channels 1 and 5), to provide
a common trigger. The coordinates of a few points are
shown in colour.
GEM data
The data sets taken on November 13 were taken with
P10 gas with Vdrift = 3475V, Vgem=3375, using the ALEPH preamplifier, and the
xray tube set at 6 kV. About 400 events are taken for each run.
The data runs are summarized below. The collimator
location is indicated using the coordinate system described above.
| run number |
x_coll (mm) |
y_coll (mm) |
| 1101 |
0. |
1.443 |
| 1102 |
0. |
1.643 |
| 1103 |
0. |
1.243 |
| 1104 |
0. |
1.043 |
| 1105 |
0. |
0.843 |
GEM data analysis
programs
The results shown below come from the gemanal program
(version 0.8) located in the directory /home/karlen/gem. An associated paw kumac
file, gemanal.kumac, is found in the same area.
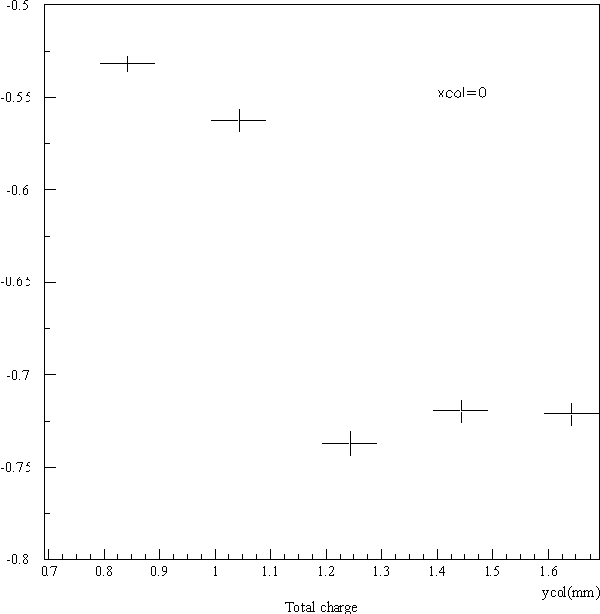
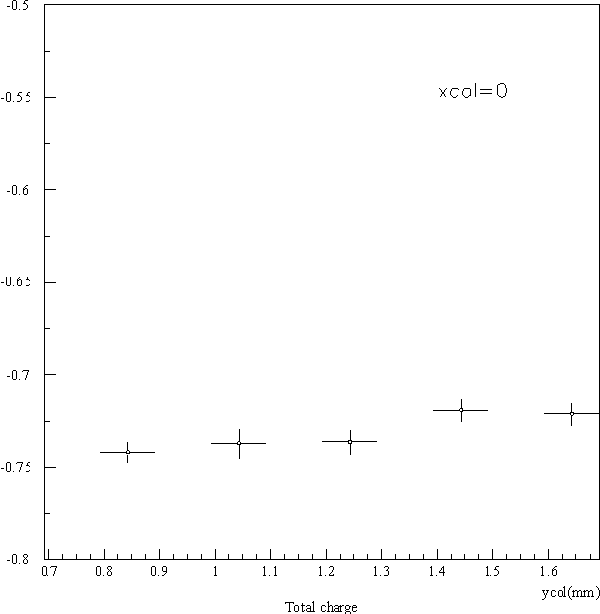
Gain variation
The gain of the system was not constant over these
runs, as can be seen in the figure linked here. There
was quite a large change from run 1103 to 1104.
Pedestals
The data for each channel is corrected by using
a pedestal defined by the average of measurements before the pulse (time bins
10-60).
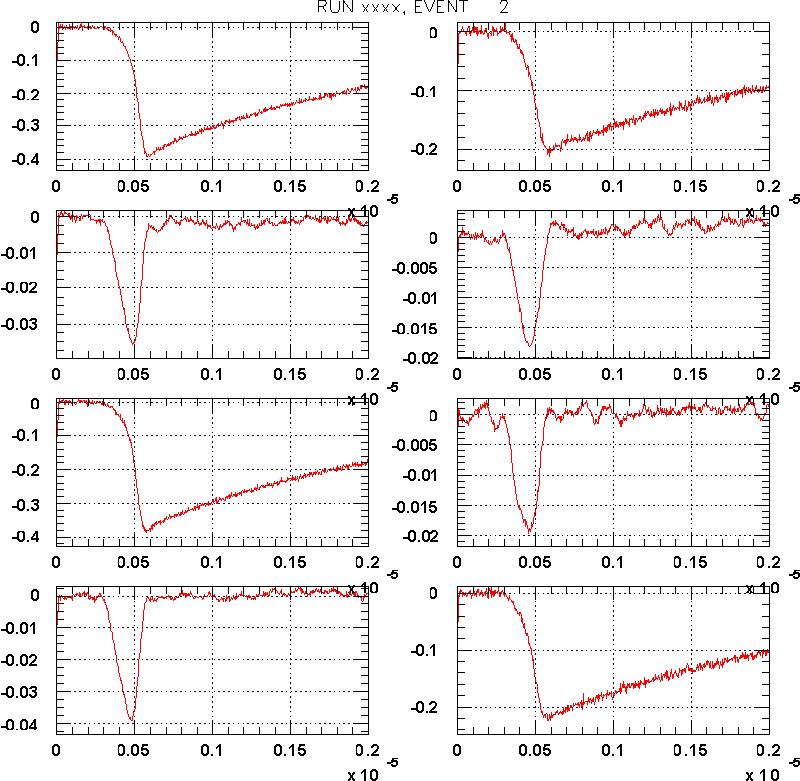
The figure linked here shows
data from a typical event, after pedestal correction, when the x-ray collimator
was positioned over the coordinate (0.,1.243) (mm).
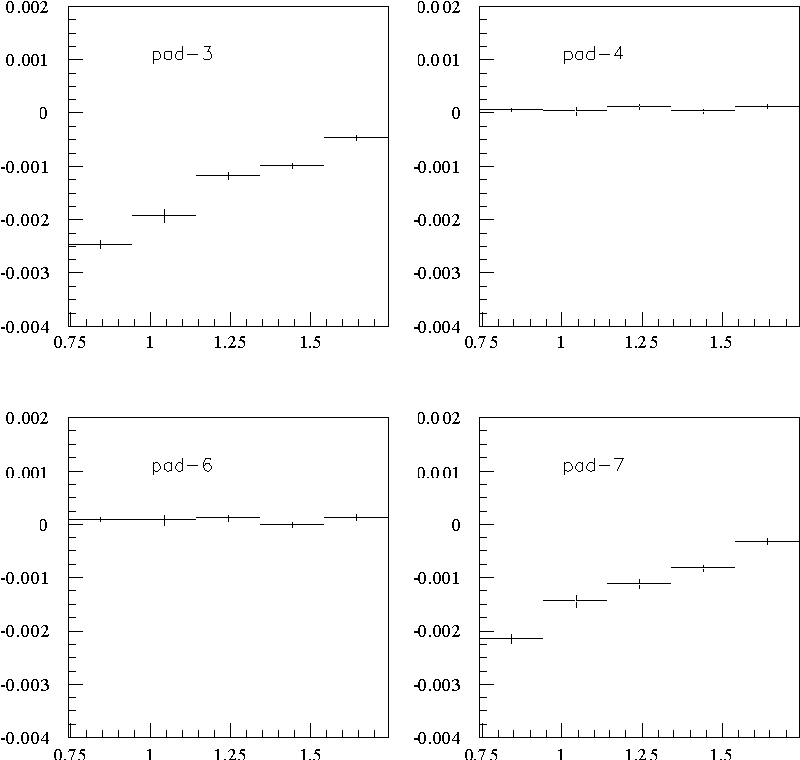
Some plots have been produced to check if the
baseline changes from run to run: The pulse shape is fit to a quadratic 300ns
- 900 ns after the induced pulse. The value of the fit at the point 600 ns
after the pulse defines the "baseline". The value of the baseline for the
different runs are shown in the figure linked here.
The baseline in pads 4 and 6 are roughly constant. The baseline in pads 3
and 7 reduce smoothly as the collimator moves closer to the centre of pad
1. Unlike the 2nd analysis, the variation is consistent with a small
amount of charge sharing: pads 4 and 7 behave similarly as do pads 3 and
6.
Separation
of direct and induced components of signals
As in the 2nd analysis, the direct charge component
of a signal is deduced from the amplitude measured a fixed time after the peak.
In this analysis, the delay is chosen to be 1200 ns (compared with 300 ns in
the 2nd analysis).
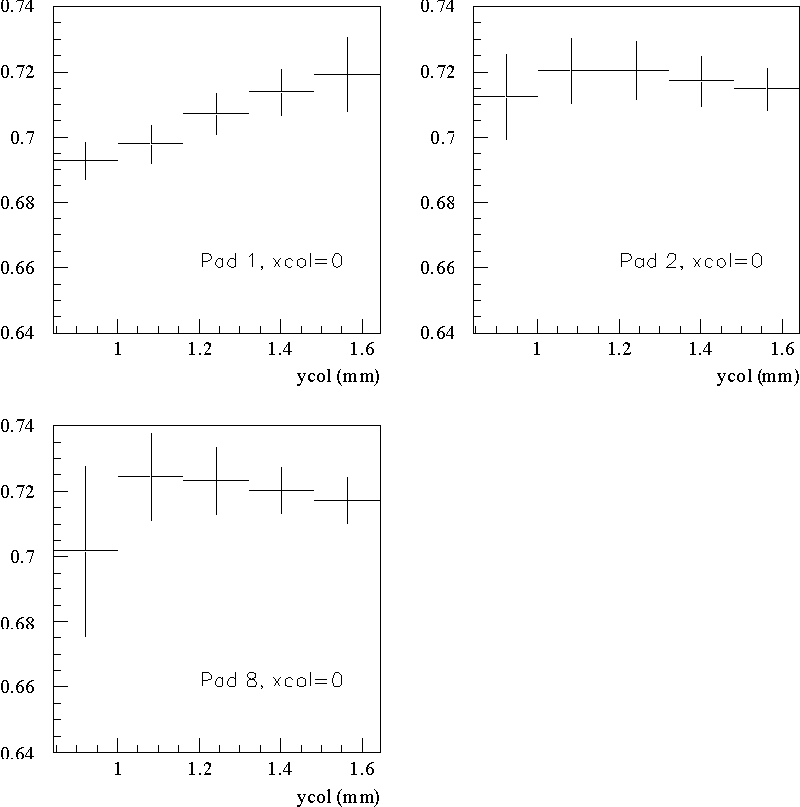
The figure linked here shows
the mean ratio of the "late" to the peak amplitudes on pads 1,2, and 8 for
different collimator positions. The error bars indicate the standard deviations
of the ratio. (The mean and standard deviations are found by fitting each
ratio distribution to a Gaussian). Since the standard deviation is less than
1%, the late amplitude is used instead of the peak amplitude for the charge
fraction determination of both direct and mixed signals. The ratios differ
for pads 1, 2, and 8, by only about 2%.
Position
analysis from direct charge sharing
Determination
of charge
The data from t The data from these runs were used
to map out the pad response function for direct charge collection. The charge
collected by a pad is assumed to be proportional to the peak amplitude of the
pulse for signals dominated by direct charge collection. Rather than use the
peak amplitude (VP) directly, the "late" amplitude (AF) is used, and scaled to
a new value (AN) corresponding to the peak
amplitude, as follows:
AN_pad = AF_pad / R_pad
where R_pad is the mean ratio of late to peak amplitudes,
from the previous section. R_1 = 0.707, R_2 = 0.721, and R_8
= 0.723.
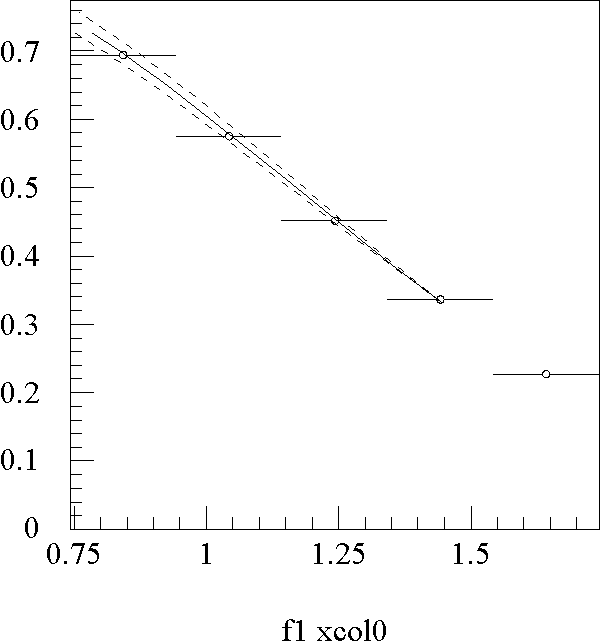
Observed
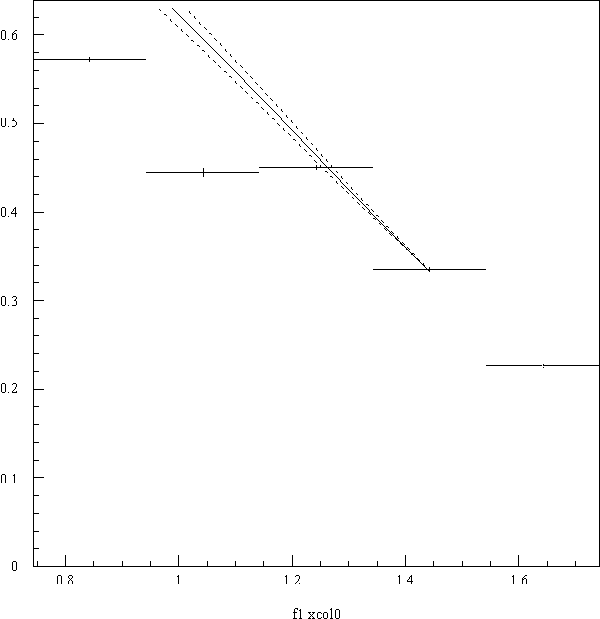
charge fraction in pad 1 - determination of cloud size
The figure linked here shows
the observed charge fraction in pad 1, as a function of the y-coordinate of the
collimator. The solid curve shows the prediction of the model when sigma_x=0.56
mm. The dashed curves show the predictions for sigma_x = 0.53 and 0.59 mm. There
appears to be a problem with the last two runs. The charge fractions in pad 1
are not consistent with expectations. Probably, the location of the x-ray collimator
is not recorded correctly. Note that these same two runs also have a much smaller
gain. In the future, these
sorts of checks should be done during data taking.
Determining
position from charge fractions
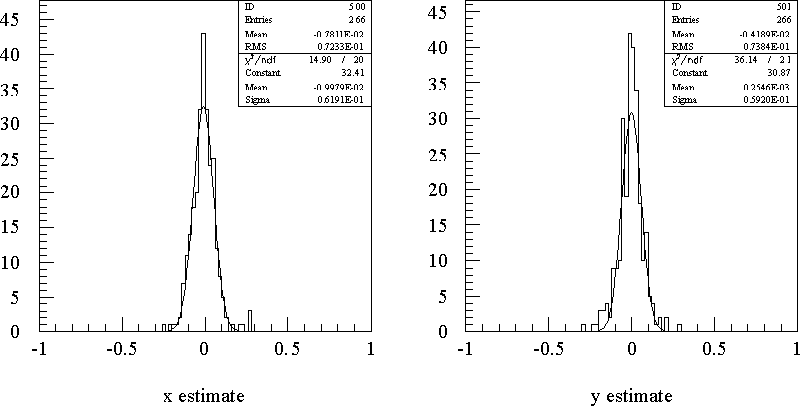
The figure linked
here shows histograms of the x and y coordinate estimates, with respect to
the x and y collimator position, for run 1101. Fitting the distributions to Gaussians,
gives central values of (-0.010 mm,0.000 mm) and standard deviations of 62 and
59 microns in x and y, respectively.
Position
analysis from induced pulses
To determine the coordinate from induced pulses,
the same approach is used as in the 2nd analysis. The amplitude of the induced
pulse is assumed to be proportional to the total charge of the event and a function
of the distance from the cloud centroid to the pad centre. An algorithm combines
the radial information from all pads that have an induced pulse to determine
the x-ray location.
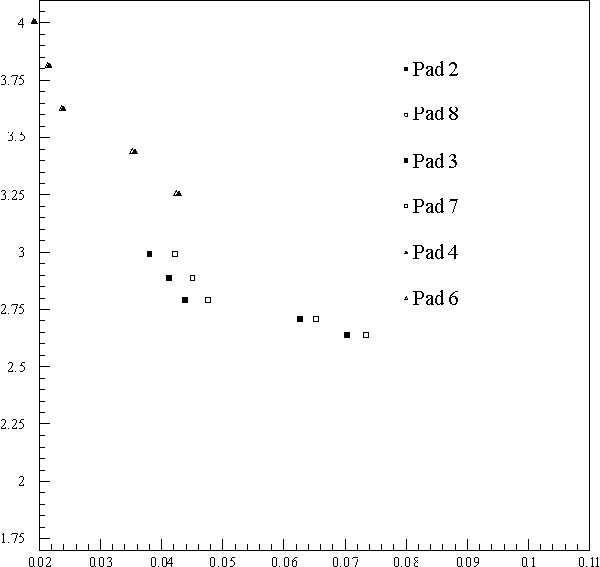
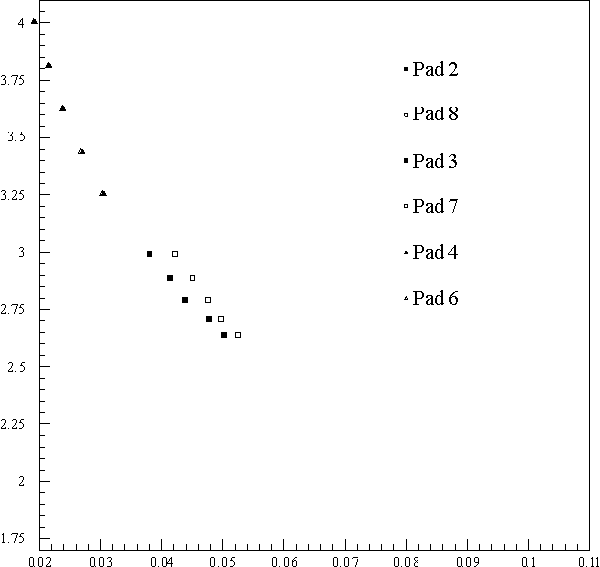
The data taken along the line (x=0) is used to
characterize the induced response function. The ratio of the peak amplitude
of the induced pulse to the total charge of the event is shown as a function
of distance to the pad centre is shown in the figure linked
here. The response function from the various pads do not line up. Simple
scaling by gain factors will not improve the agreement. This further indicates
that a problem exists with the data... the location of the xray collimator
is possibly incorrect.
Conclusion
The data from November 13, 2000 shows some problems:
the x-ray location and gain of the two final runs are anomalous.
Update (November
14)
By looking at the individual channels for the different
runs, it is evident that the problem that occurs for the last two runs is most
pronounced in the centre pad (channels 1 & 5). It appears that the pre-amp
gain for that pad was reduced by a factor of
1.7. When correcting for this, the gain variation is
much more stable, the variation in the charge fraction
in pad 1 follows the expected form with sigma_x = 600 microns,
and the ratio of the peak amplitude of the induced pulse
to the total charge of the event lines up much better. The connection for
pad 1 and the preamp gain for the pad should be checked.
Update (November
20)
Source of problem was identified: Incorrect termination
of signals to scope for channels 1 & 5.