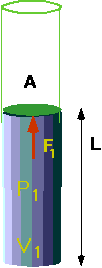
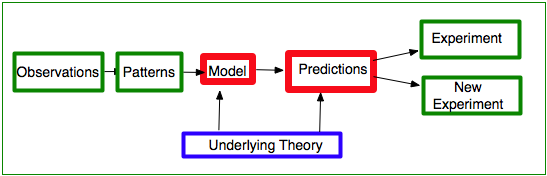
The first understanding of this comes from looking at gases.
A man who is ignorant of the second law of thermodynamics can no more claim to be educated than a scientist who has never read Shakespeare or Milton (C. P. Snow, paraphrased)
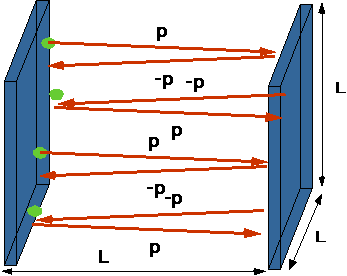
Essentially the relative probability of finding a particular arrangement by chance. If arrangement is improbable, we can always get work out of it.
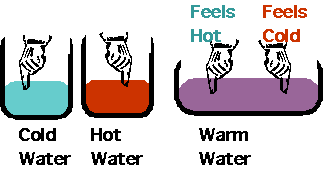
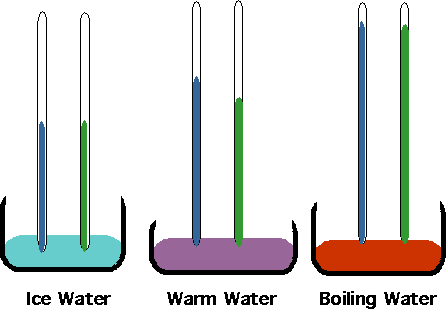
- Hot gas + cold gas <--> warm gas
-
Gas molecules will randomize themselves very fast
-
Microscopic Version of Second Law
-
a system will always tend towards the most random arrangement
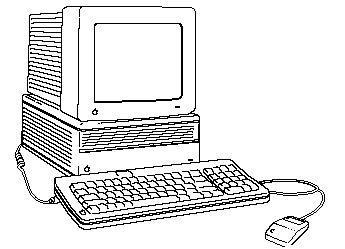
| Low entropy Macintosh! |
 |
| High Entropy Macintosh! |
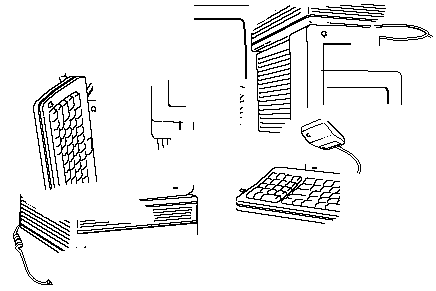 |
- It is very probable that dropping a Mac will rearrange it in a more randomly
ordered form!
-
Dropping it again (once or one million times) is not likely to get it working
again!
Another version of the 2nd Law:
Entropy tends to increase in a closed system.
- Of course we can decrease entropy locally:
-
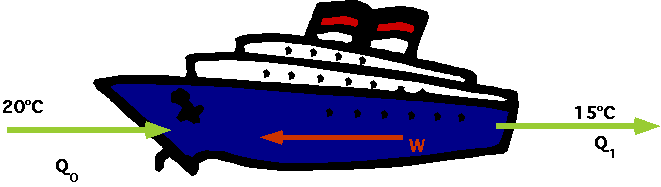
| How about a fridge? Initially room & fridge at same temp., afterwards T0
< T1
|
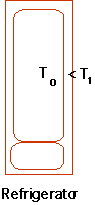 |
- Fridge is not a closed system: must include power station. How about hydro-power?
| Where does the hydro power come from? |
 |
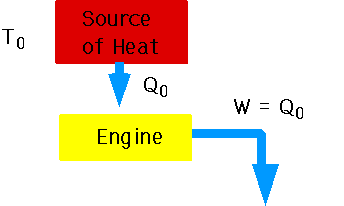
- Degradation of energy: high temp. energy in sun <--> low temp. energy here
- Note that the nomenclature complicates things unnecessarily: it would be easier
if heat was called energy (or maybe heat energy) and entropy was called heat.
Then paraphrase of 2nd Law would be
- All forms of energy get converted into heat energy. Once all the heat is at the same temperature, can get no further work.
Murphy's versions of the laws of thermodynamics
- 1st: You can't win
- 2nd: You can't break even
- 3rd: You can't quit the game
- No, don't put them on an exam!
2nd law and evolution
- 2nd law has profound philosophical consequences: e.g:
-
| Clearly complexity of animals has increased over history of earth. We are more
ordered than amoebas (no moral judgments here!) |
 |
-
Therefore evolution contradicts 2nd law?
- Not a closed system!
The connection with time..how is tomorrow different from yesterday?
-
- The "arrow of time" is defined via an increase in entropy.
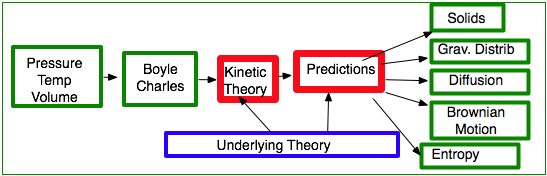
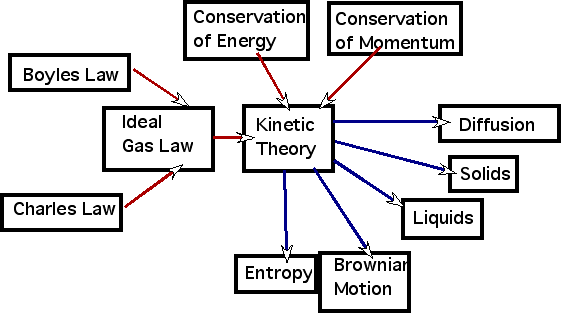
Kinetic theory
provides the understanding for a large number of phenomena:
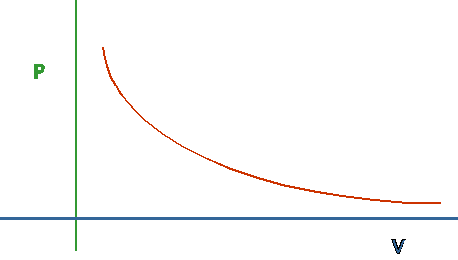
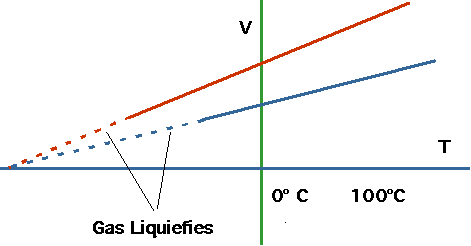
- Boyles/Charles/Ideal Gas law
- Entropy & 2nd law
- Diffusion: why should you stir your coffee to spread the sugar around?
- Conductivity of metals. Can treat the electrons as a gas colliding with the lattice atoms.
| Liquids, solids and gases: need to extend model to have forces which are attractive at long range |
|
| Gravitational Variations in pressure: why is air pressure on a mountain top lower than at sea level and the temperature is lower? |
|
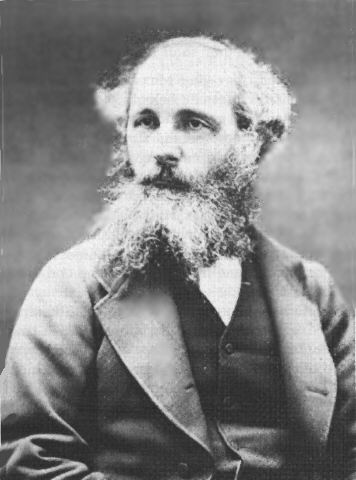
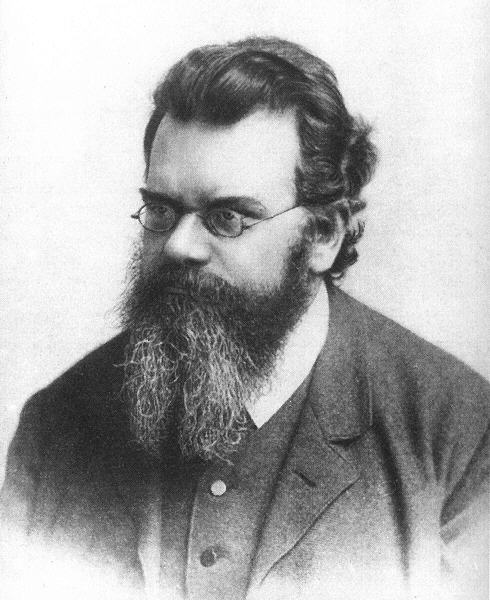
Since the kinetic theory is "obvious" it must have been discovered very early? Almost all scientists associate it with James Clerk Maxwell, who developed it around 1860.
- Result: work rejected by the Royal Society of England
- Waterston (1845), avoided the technical mistakes that Herapath made. He was absolutely correct in every important way. The referee’s report reads:
To the Secretary of the Physics Committee, R.S.
Dear Sir,
I have received a paper, from the clouds for ought I know, but I conjecture that it may have been sent to me by Mr. Weld for a report.In my opinion the paper is nothing but nonsense, unfit even for reading before the Society.
I am, dear sir
Yours very sincerely
Lubbock
- (Lubbock was an eminent mathematician). The Royal Society refused to return the paper to Waterston so he had no copy. It was rediscovered by Lord Rayleigh, and to some extent publicised by Rayleigh and later by J. B. Haldane. Waterston’s nephew wrote that
"We could never understand the way in which he talked of the learned societies, but any mention of them brought out considerable abuse without any definite reason being assigned."
Heat in summary:
Looks like a disconnected series of phenomena but can understand
it in terms of kinetic model Most fundamental principles
First law
,
which is (almost)
conservation of energy
δU = Q-W
Second law:
Entropy increases in a closed system
Note what we have done in all this discussion: we have taken
- Newton's laws of motion
- Conservation of Momentum
- Conservation of Energy
- and a model for what a gas is.
|
 |
In terms of our scientific model
Chaotic Motion
She comes, she comes, the sable throne behold
Of Night Primeval and of Chaos old!
...
Physic of Metaphysic begs defence
and Metaphysic calls for aid on Sense
See Mystery to Mathematics fly
In vain! they gaze, turn giddy, rave and die
....
Lo! thy Dread Empire, Chaos is restored
Light dies before thy uncreating Word.
Alexander Pope, The Dunciad
Up to know we have discussed two kinds of system:
- Deterministic: i.e. systems whose future can be predicted exactly
e.g. planetary system, mass on a spring, pendulum.
- Random systems: i.e. ones which are too complex to predict exactly
e.g. gas, society...Best we can do is to predict average values
- However there are two other kinds of systems:
- Chaotic: i.e. systems which are predictable over the short term but not over the long term.
- Quantum: systems which are intrinsically unpredictable except in a special sense.
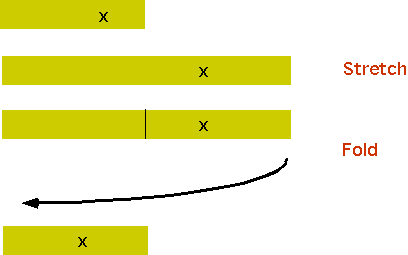
Chaotic systems:
the easiest one to visualize, although technically it is not chaotic, is the "baker transform"
The formula is
xn =2xn-1 if 2xn-1 < 1
xn =2xn-1 -1 if 2xn-1 > 1
|
 |
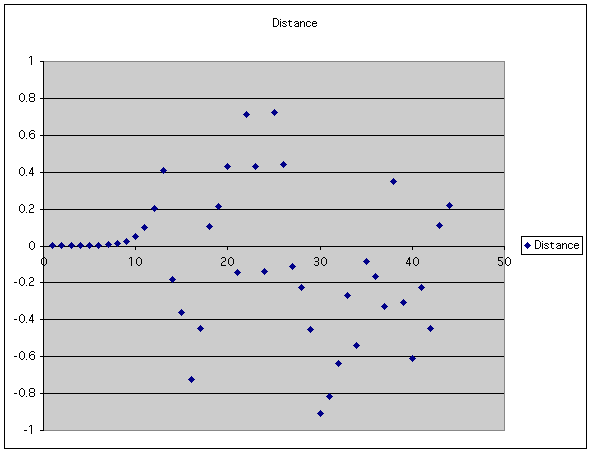
For example, we can start with two points very close together and see what happens:
| Step |
Particle 1 |
Particle 2 |
Distance |
| 1 |
0.001 |
0.0011 |
0.0001 |
| 2 |
0.002 |
0.0022 |
0.0002 |
| 3 |
0.004 |
0.0044 |
0.0004 |
| 4 |
0.008 |
0.0088 |
0.0008 |
| 5 |
0.016 |
0.0176 |
0.0016 |
| 6 |
0.032 |
0.0352 |
0.0032 |
| 7 |
0.064 |
0.0704 |
0.0064 |
| 8 |
0.128 |
0.1408 |
0.0128 |
| 9 |
0.256 |
0.2816 |
0.0256 |
| 10 |
0.512 |
0.5632 |
0.0512 |
| 11 |
0.024 |
0.1264 |
0.1024 |
| If you plot the , it looks nice and smooth to start with, but suddenly looks random. |
 |
The real physics applications relate to the Lorenz equation and similar.
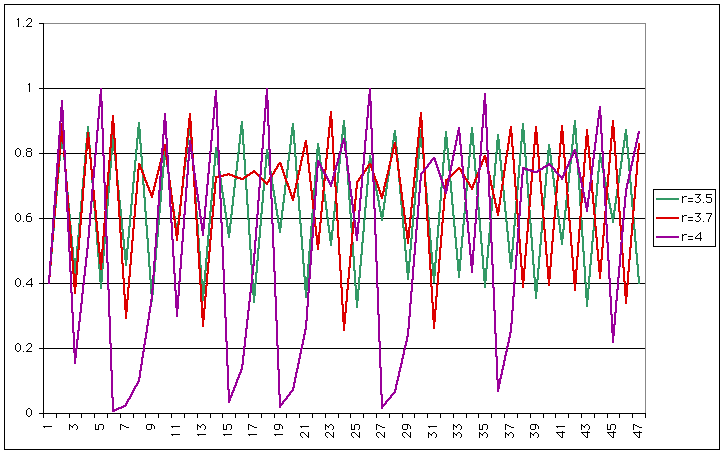
The easiest to visualize is the "logistic map", which originally arose in modelling population growth. All chaotic systems have some common features
- The equations must all be non-linear
- There are regions of the parameters where the motion is predictable
- There are regions where it is chaotic
- In the chaotic region, points that start off close together become wildly different as time goes on.
Dynamic Map:
- Suppose we have a population which grows
No. of births ∝ No of live individuals
xbirth = k x
- No. of deaths ∝ no. of live individual
xdeath = k'x
- So total number in next generation is
xn = (1+k-k')xn-1
- If this is all, population grows exponentially.
| This is what happens for r = 2 (say) |
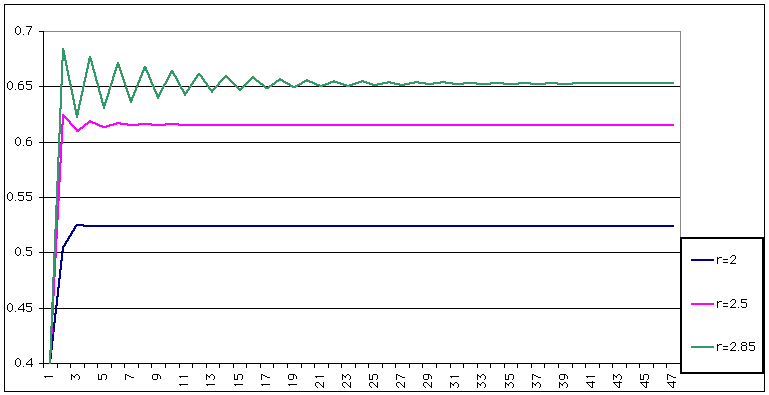 |
| However, for r = , a curious effect arises: the number actually oscillates. |
 |
| This doesn't seem too bad, until you increase r a bit more |
 |
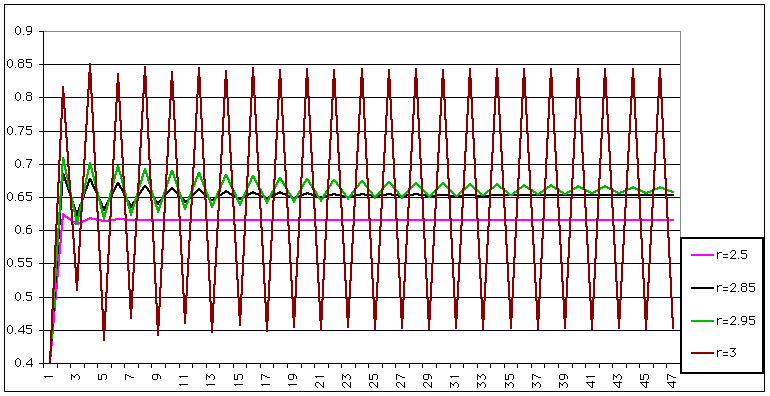
| Now you have a period 4 (same period, but two different heights). If we increase r a little more, the behaviour becomes chaotic |
 |
There is a nice way of seeing this: a "logistic map." (1Dmap) One can iterate between the curves
y = x
y = r x(1-x)
| For small r = 2.9 we get iteration to the "stationary point" |
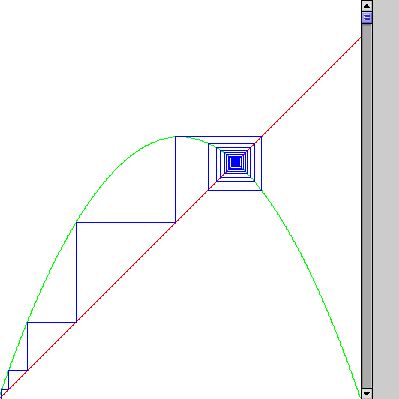 |
| For medium r = 3.16 we get a "period 2" |
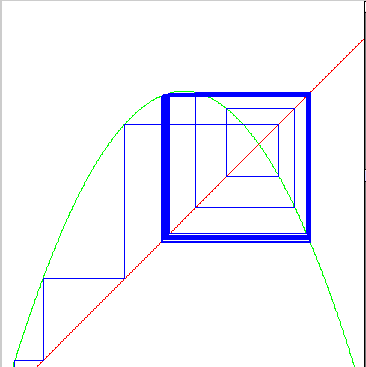 |
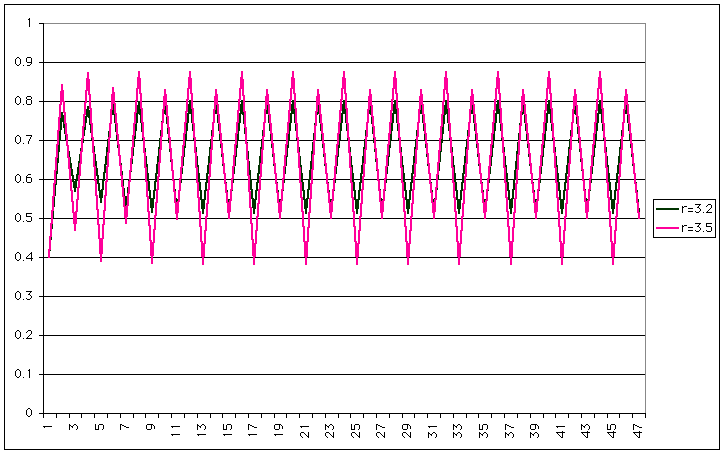
| For slightly larger r = 3.59 we get a "period 4" |
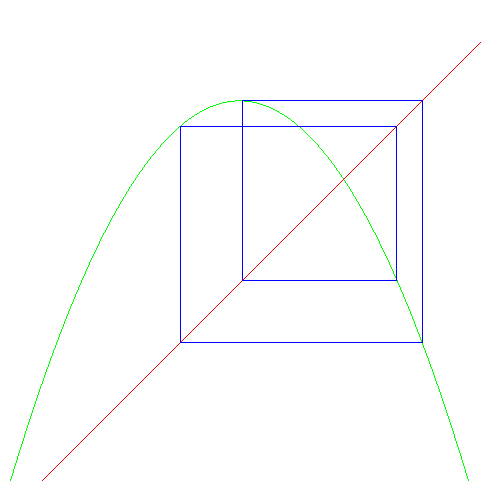 |
| For large r = 3.66 we get chaos |
 |
Assignment: these come from a web-site
http://math.la.asu.edu/~chaos/logistic.html
Go to this site and experiment to find the exact value at which period doubling starts, and which the period 4 starts and see if you can find a period 8 solution.
| It is possible to plot the period: this is a "bifurcation diagram" |
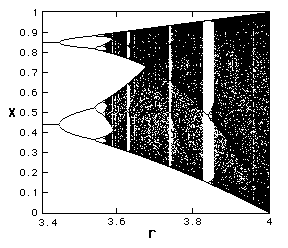 |
| and we can look at this in a bit more detail: |
 |
What was totally unexpected was that such a simple system could have such a complex behaviour. Note that period doubling repeats itself, after chaos sets in there are still regions of the parameter r for which the solution is simple!
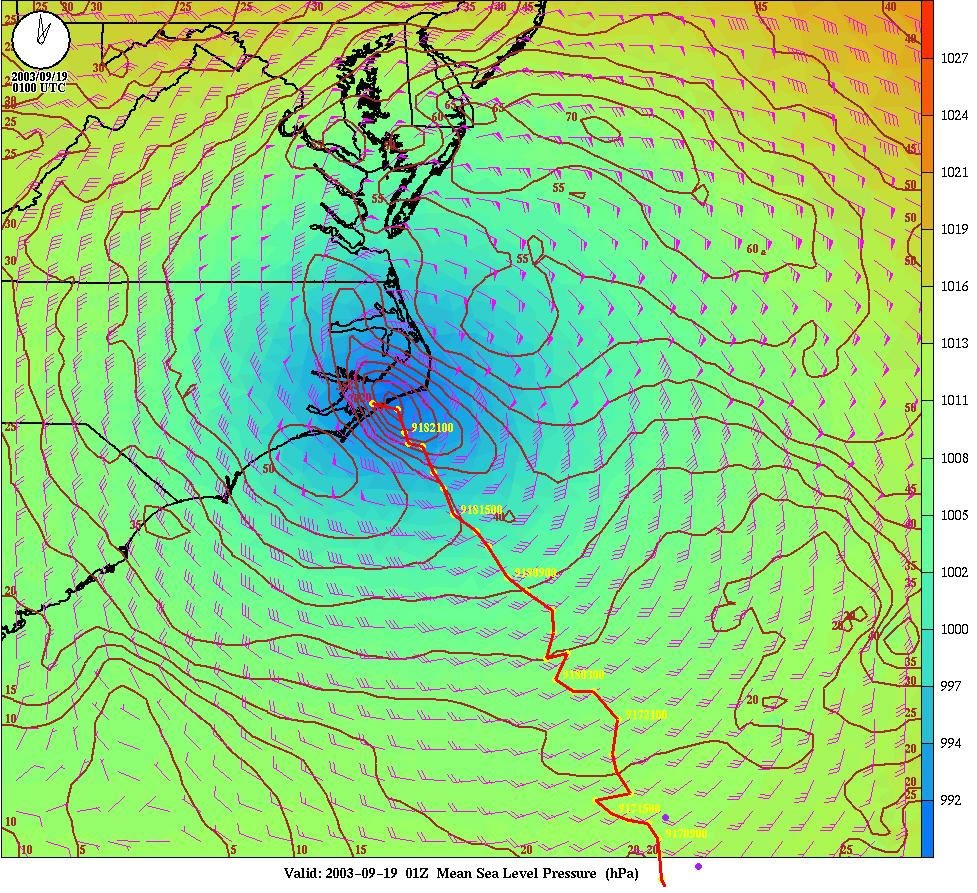
The most famous example is weather. "Primitive Equations" written down by L F Richardson (1922). Can't be solved without computer
“After so much hard reasoning, may one play with a fantasy? Imagine a large hall like a theatre, except that the circles and galleries go right round through the space usually occupied by the stage. The walls of this chamber are painted to form a map of the globe. The ceiling represents the north polar regions, England is in the gallery, the tropics in the upper circle, Australia on the dress circle and the antarctic in the pit.
A myriad computers are at work upon the weather of the part of the map where each sits, but each computer attends only to one equation or part of an equation. The work of each region is coordinated by an official of higher rank. Numerous little "night signs" display the instantaneous values so that neighbouring computers can read them. Each number is thus displayed in three adjacent zones so as to maintain communication to the North and South on the map.
From the floor of the pit a tall pillar rises to half the height of the hall. It carries a large pulpit on its top. In this sits the man in charge of the whole theatre; he is surrounded by several assistants and messengers. One of his duties is to maintain a uniform speed of progress in all parts of the globe. In this respect he is like the conductor of an orchestra in which the instruments are slide-rules and calculating machines. But instead of waving a baton he turns a beam of rosy light upon any region that is running ahead of the rest, and a beam of blue light upon those who are behindhand.
Four senior clerks in the central pulpit are collecting the future weather as fast as it is being computed, and despatching it by pneumatic carrier to a quiet room. There it will be coded and telephoned to the radio transmitting station. Messengers carry piles of used computing forms down to a storehouse in the cellar.
In a neighbouring building there is a research department, where they invent improvements. But these is much experimenting on a small scale before any change is made in the complex routine of the computing theatre. In a basement an enthusiast is observing eddies in the liquid lining of a huge spinning bowl, but so far the arithmetic proves the better way. In another building are all the usual financial, correspondence and administrative offices. Outside are playing fields, houses, mountains and lakes, for it was thought that those who compute the weather should breathe of it freely.” (Richardson 1922)
- The "Lorentz" equations: this is a very simplified version of the equations that describe weather.
- These give rise to chaotic behaviour: hence it is plausible that weather itself is chaotic.
- You cannot predict the future weather precisely.
However, buried in this are some predictable elements.
- e.g. we cannot predict an "el Nino" event, but we can predict the consequences once it has happened.
- Note "weather" prediction and "climate" prediction are (almost) unrelated
-
| But we can still predict weather in the short term |
 |
George Mason U camp.gmu.edu/significant_ weather_prediction.html
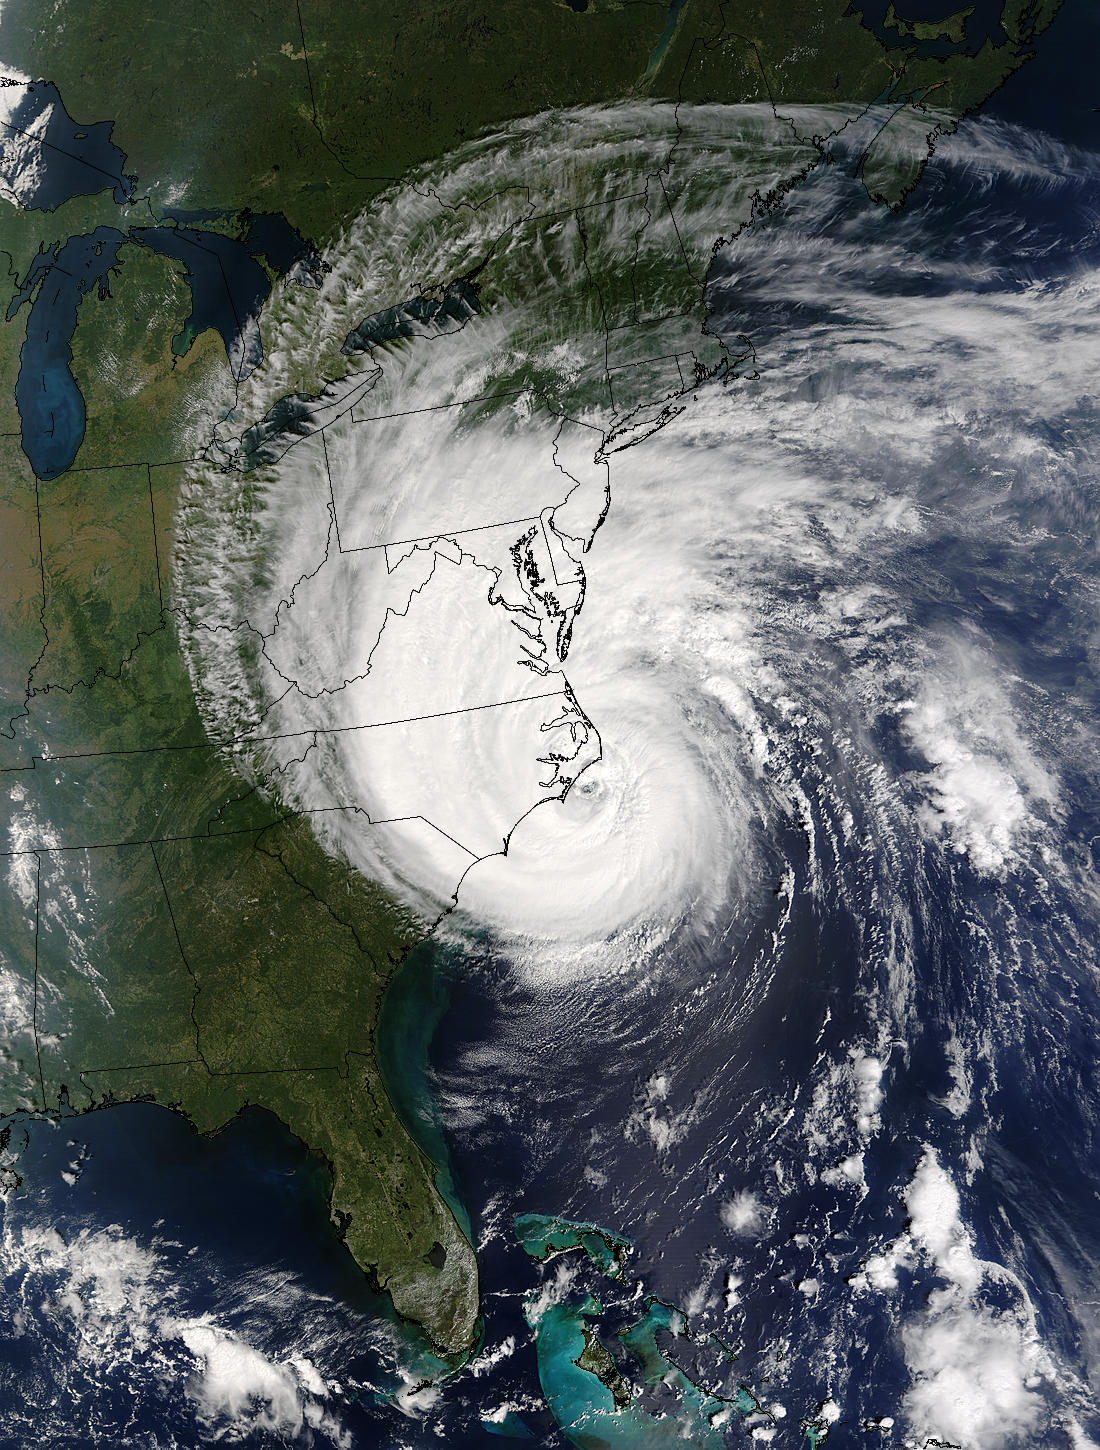
| And this is what Hurricane Isabelle actually looked like! |
 |
Now we know enough to look at The Universe