
Credit: ESO, Stefan Gillessen (MPE), F. Eisenhauer, S. Trippe, T. Alexander, R. Genzel, F. Martins, T. Ott
| The brightest stars have names that derive from (usually) Arabic: e.g. Ursa Major |
|
The most useful catalogs are ones of specific objects: e.g. Messier (pr. Messié!)
the most famous catalog consists of things that aren't comets(!):
|
 Credit & Copyright: P. Gitto |
Easiest observation about stars is that some are brighter than others. Hipparchus defined brightest to be of first magnitude, down to the dimmest of sixth magnitude.
Distance to stars is measured by parallax |
 |
| Angle of parallax is defined w.r.t. very distant stars. (Why is π used as a symbol of an angle? Stupidity) |  |
e.g sun: m = -26.7, M = 4.83
Apparent motion of stars (due to parallax) gets mixed up with real motion of star. Since proper motion is cumulative, it can be measured much more accurately. |
 |
| Note that Doppler measures motion away from us, proper motion measures it perpendicular to our line of sight. |
|
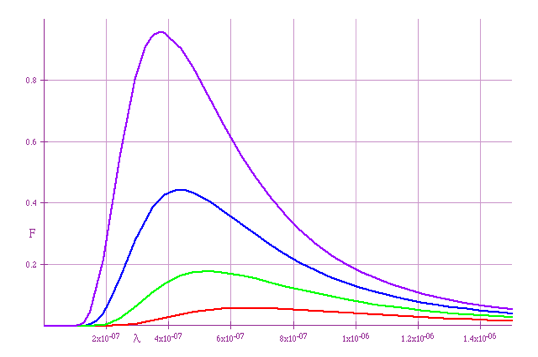
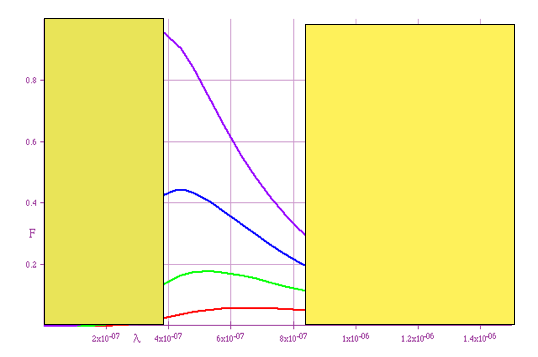
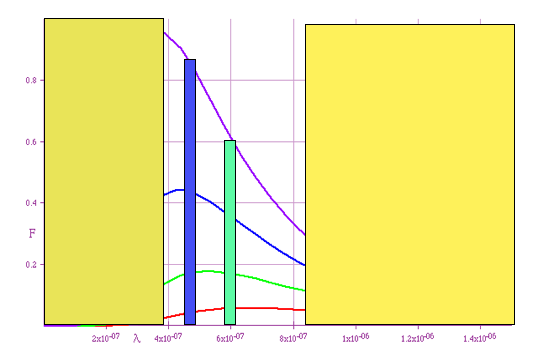
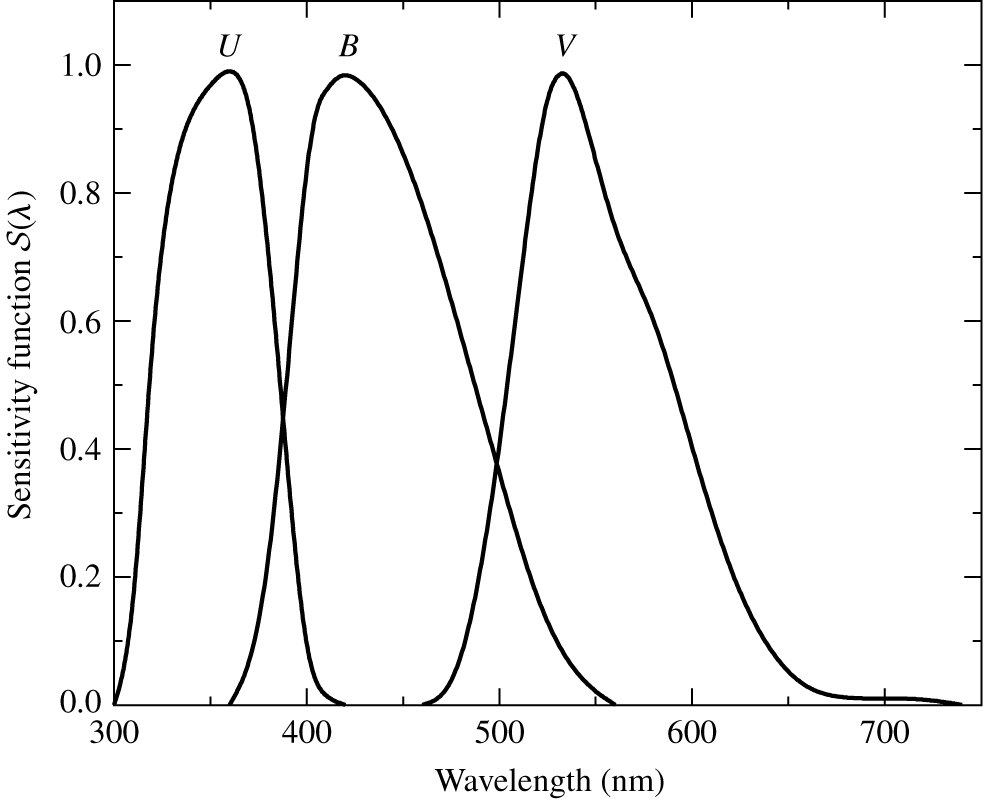
However can measure the effective temp by sampling at 3 different wavelengths, originally with filters
If the V filter has a response \color{red}{S_V \left( \lambda \right)} then the total visual flux is
\color{red}{
F_V = \int {F\left( \lambda \right)S_V \left( \lambda \right)} d\lambda }
|
|
roughly agrees with what is seen by eye
Vega
Aldebaran
Note hotter (bluer) stars show more H, less complicated spectrum
| This provides a direct measure of the surface temp of the star. This allows us to classify stars according to their spectra | 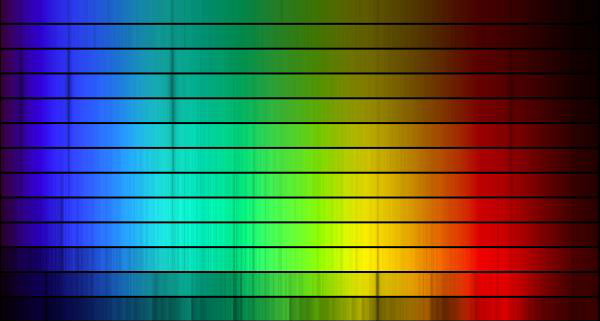
Stellar Spectral Types: OBAFGKM Credit & Copyright: KPNO 0.9-m Telescope, AURA, NOAO, NSF |
| O | Hot Blue stars | T>30000 | prominent HeII and ionized metals. |
| B | Blue | 30000>T>15000 | HeI & strong H lines. |
| A | Bluish | 15000>T>10000 | H and FeII. |
| F | White | 10000>T>7000 | H, CaII and neutral metals. |
| G | Yellow | 7000>T>5200 | CaII & neutral metals. |
| K | Orange | 5200>T>4500 | neutral metals. |
| M | Red | 4500>T>2500 | neutral metals & TiO. |
| CRNS | all cool stars | different concentrations |
| Note this is (generalised) combination of Boltzmann & Saha | 
|
These are subdivided into 10 smaller classes running from 1 to 10: e.g. the sun is a G2 star.
| A mnemonic |  |
Having got two quantities (magnitude/luminosity & colour/type) it is natural to plot one against the other.
Note: the HR diagram is crucial to understanding stars
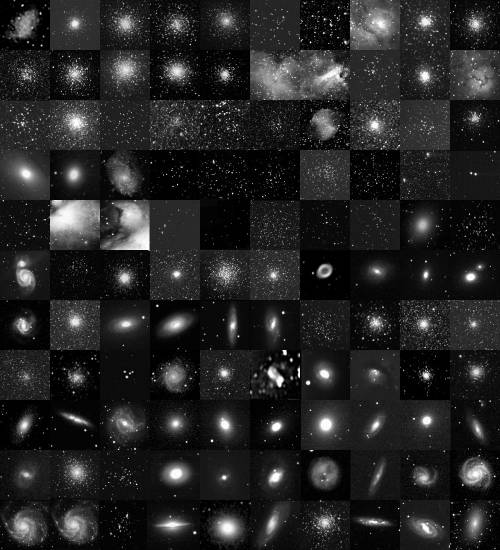
| If we look at bright stars, the results are biased, since we see a very few, very distant objects. |  |
| General stars show a very distinct pattern |  |
If we look at clusters of stars, they are presumably all at the same distance and the same age: hence expect that we should be able to learn something about how age & luminosity & spectral type are related.
| The best known cluster is the Pleiades: (Seven Sisters except we can only see 6 now) |  |
| A closer look: the Pleiades are a very young group (∼ 50) of stars, about 107 years old, and very close: about 40 light-years, so light takes 40 years to travel from them. Note the "star-stuff" still blowing away. |  |
| Age probably ∼ 30 × 106 years. Note all are on the main sequence |  |
| e.g. Hyades ∼ 108 yrs Note four stars which have become red giants. |
 |
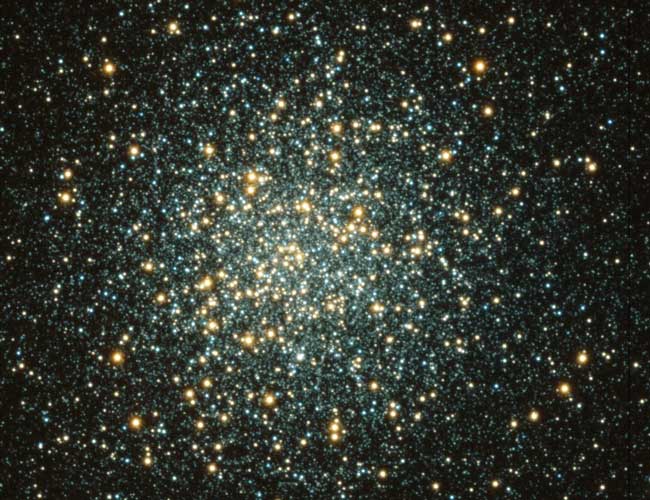
| e.g. M3 which is a very old globular cluster note no bright blue stars at all
(these are app. mags) |
 |
|
 |
Many stars occur in multiple groupings: Roughly
| single: | binary: | ternary: | quaternary |
| 45% | 46% | 8% | 1% |
| Astrometric Binary (e.g. Sirius) Proper motion show "wobble", which can be put down to unseen attracting body |  |
| Actual orbit can be deduced from path: Sirius B is too close to A for most of its orbit to be seen |  |
| Only seen as single object, but spectral lines show recurrent doubling due to Doppler shift |  |
| Actual changes depend on orientation of orbit w.r.t observer |  |
Note that each component of Mizar is a spectroscopic binary: i.e. it is a double-double
(note that double-doubles can have stable orbits: random sets of four stars almost never do, and usually one star will end up being ejected)
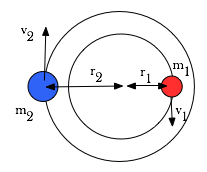
Unfortunately need to extract shape & inclination of orbit from velocity curves which can be difficult: we'll assume they are edge-on and circular.
| Can be done for either visual binaries or spect. binaries:
\color{red}{
r_1 = \frac{{v_1 P}}{{2\pi }},r_2 = \frac{{v_2 P}}{{2\pi }}}
C.o.M must be fixed, so
\color{red}{
m_1 r_1 - m_2 r_2 = 0 \Rightarrow \frac{{m_1 }}{{m_2 }} = \frac{{r_2 }}{{r_1 }} = \frac{{v_2 }}{{v_1 }}}
Then can use Kepler's 3rd law
\color{red}{
P^2 = \frac{{4\pi ^2 }}{{G\left( {m_1 + m_2 } \right)}}r^3 }
|
 |
| Light curve usually shows two minima: in the case of Algol, luminosites very different |  |
Assume
| Obviously
\color{red}{
2r = v\left( {t_2 - t_1 } \right) = v\left( {t_4 - t_3 } \right)}
and
\color{red}{
2\left( {R + r} \right) = v\left( {t_4 - t_1 } \right),a = \frac{{vP}}{{2\pi }}}
|
 |
| We discover that \color{red}{R \sim M^{1/2} } for a normal star: i.e. densities of large stars are lower |  |
| Can use eclipsing binaries to measure stellar rotation ratess
Normally, spectral lines come from the whole star: at the moment of eclipse, they come from the edge only |
 |
| e.g. βLyrae has two components distorted into ellipses,(found by light curve) surrounded by a large gaseous envelope. |  |
Roche lobes are limits of stability for gas to be bound to one star: if one star fills its Roche lobe, then gas will flow to the other star.
Note that it is usually the smaller (and hence denser) star that pulls in material from the larger.
In summary, what we learn from binaries:
| Led to the discovery that Betelgeuse (α Or.) is a ternary system, with B component revolving inside the envelope of A (the red giant) |  |
Divided loosely into
|
 |
| Star pulsates a with period of a few days e.g. δ Cephei Period ≈ 5.4 days, Magnitudes changes M ≈ 3.6-4.3 Spectral type changes (i.e. star heats up and cools down). Star actually expands: can be monitored by Doppler |
 |
Polaris is much weaker Cepheid: Δm ≈ .1 (Δm actually seems to be -> 0)
| Cepheids are giants which have just moved off the main-sequence. Since M ≈ -1 to -6, they act as very useful distance markers: period \color{red}{P \propto M}
�, so by measuring m and P, one can get distance.
RR-Lyrae: similar behaviour, but much smaller objects (.7M₀) |
 |
Polaris is much weaker Cepheid: Δm ≈ .1 (Δm actually seems to be -> 0)
| e.g. Ο Ceti (Mira) changes from m = 9 to 3 (!) over period of 11 months Spectral type changes from M5 to M9 | 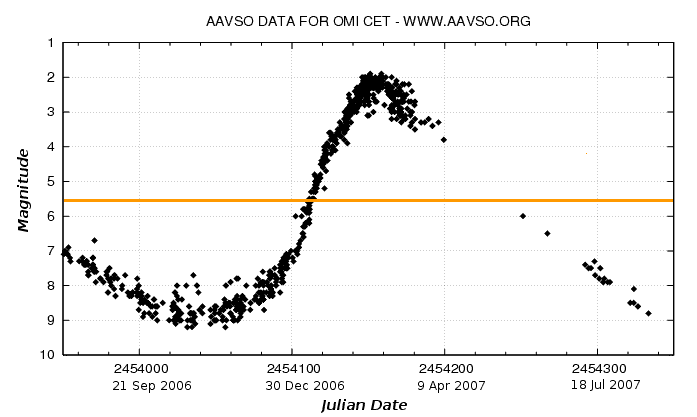 |
| Mechanism not known, but probably connected to strage shape of star (distorted by WD companion) | 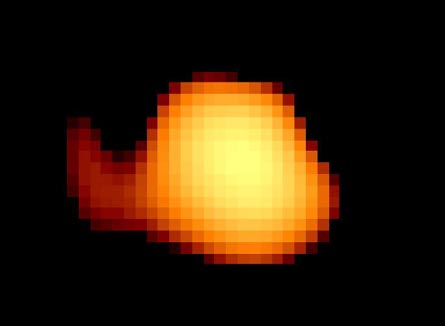 |
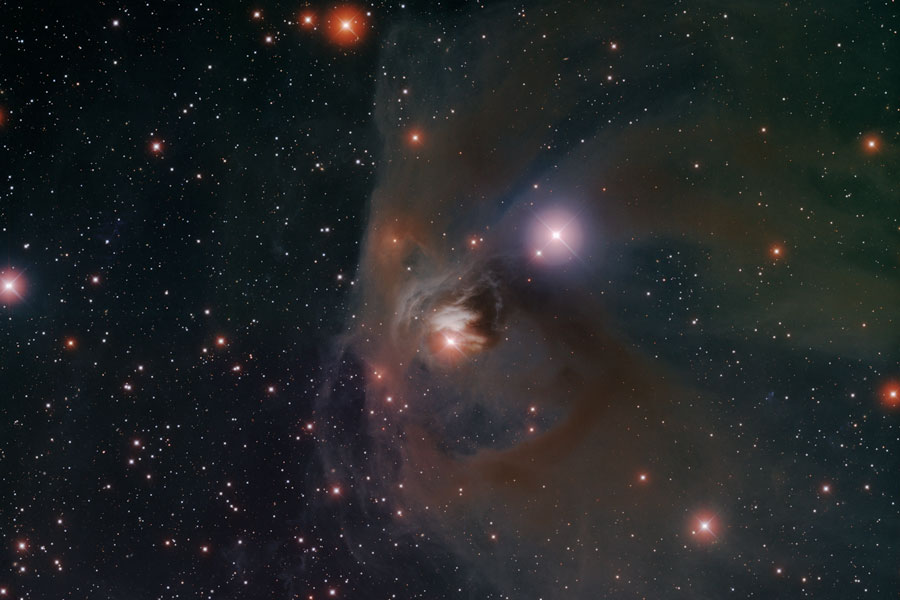
| T-Tauri: shows weird spectrum with too much UV, too much IR (i.e. long way from black body) and many peculiar lines (e.g. ice!) Can change magnitude very rapidly, e.g. X-ray flux can change by a factor of 10 in minutes
Beleived to be proto-stars about 105 years after collapse of dust-cloud (see later) |
 |
| Nova Cygni, Aug 28th-30th 1975 15th magnitude ................................................................. 2nd magnitude. Rapid rise followed by slow decrease |
 |
| Old photos exist which show m < 16 until July 1975 |  |
| Large amount of material (say 10-4 M0) thrown off star and ejected into space at v ≈ 100 km/s. Material can sometimes be seen later as nebula surrounding the star. N. Persei . . . . . . . . . . . . . .N Herculis |
 |
| Some novae are known to have repeated: e.g. N Persei is surrounded by several shells of gas |  WIYN Telescope Consortium |
Most novae are binaries (rest may be undetected binaries).
| Standard model: Material flows from red giant to dwarf. Extra energy generated by infalling material heats up surface of the star, triggering nuclear burning. Heat in the outside layers blows off much of the material. Explains repeatability of process (evry few hundred years), |
 |
| e.g. V838 Monocerotis: Not a nova, since star did not lose material, instead went to M~ -7 (brightest star in galaxy) bay expanding and cooling very fast |  Lisa Crause (Univ. Cape Town), Warrick Lawson (Australian Defence Force Academy) |
| See light echoes from old dust clouds | 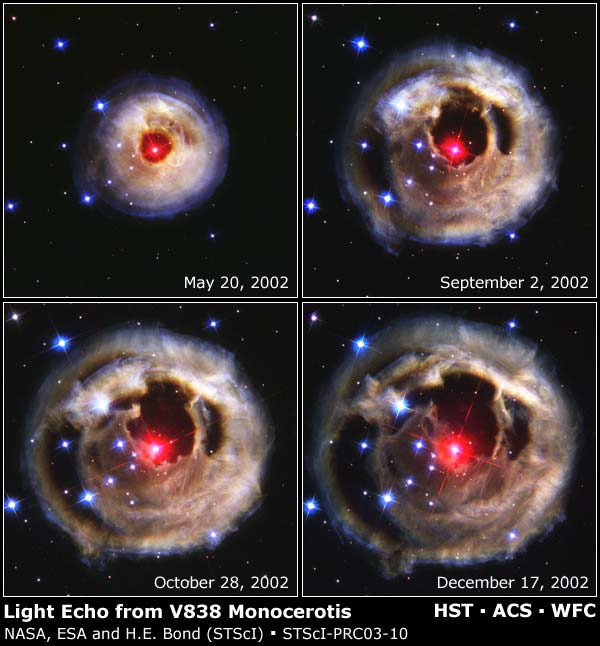 HST |
| Very unstable supergiant stars: this is "Thor's Helmet" | 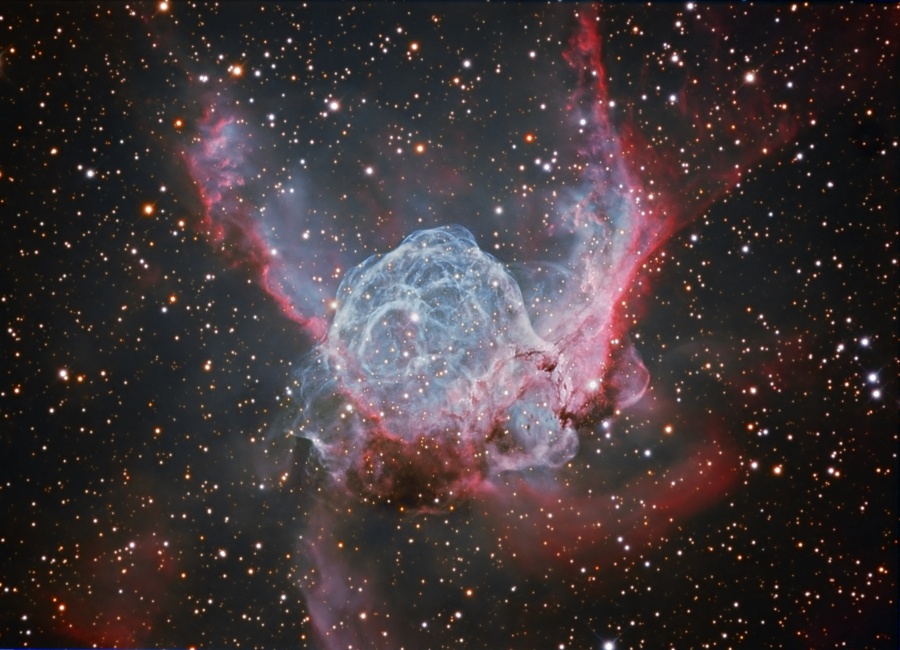 Star Shadows Remote Observatory and PROMPT/UNC |
| Mass-loss is so large that outer layer of star is being stripped away continuously, revealing hotter lower layers.
M ≈ 20 M0, extremely hot blue stars with narrow absorption lines and broad blue-shifted emission lines: Implies a star with a very extended atmosphere, which is rapidly losing material ΔM ≈ 10-5 M0/yr (i.e. can lose its whole mass in 106 years) |
 |
| Red dwarfs, which show very sudden and brief increase in luminosity, along with strong radio burst. |  |
Flare in sun produces ≈ 1% increase in luminosity: if magnetic field was 10 × stronger, and luminosity 10-3 as large, the same mechanism would give a 5 magnitude increase in luminosity
However some stars do not follow this pattern: in particular all globular cluster stars and many Milky Way stars are metal-poor (≈.1%)<
| Regular stars are Population I
Metal poor stars are known as Population II. Hence we could really think of them as MS stars shifted a bit to the left) These are very old stars: formed before there was much metal created by supernovae< |
 |
Carbon stars have large amounts of C in their atmospheres, even showing C2 and CN bands
Heavy metal-oxide stars: ZrO, LaO, YO
All of these are very rare and not understood
Fields very variable, spectrum of stars changes with fields
Note
|
 Credit & Copyright: T. Rector (U. Alaska Anchorage), Gemini Obs., AURA, NSF |
| Eagle Nebula: Cluster of stars just formed in centre of dark shell of dust and gas, taken with the 0.9-meter telescope on Kitt Peak, Arizona, USA. Part of M16 | 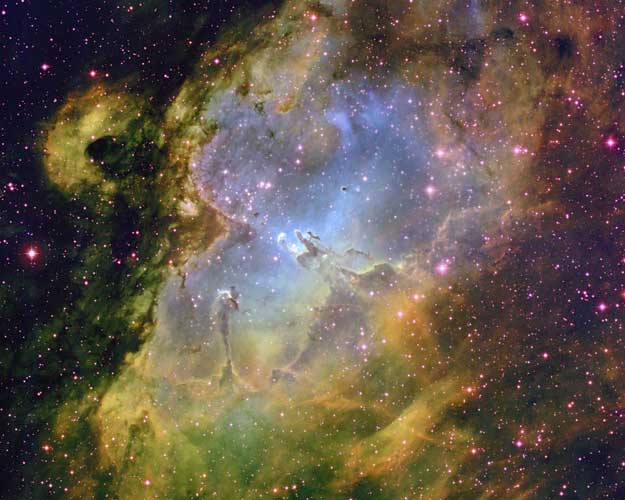
Credit & Copyright: T. A. Rector & B. A. Wolpa, NOAO, AURA, |
| Eagle close up: pink light is sulphur. Young stars excite the gas so it glows around the "birth pillars". Large stars will go supernova in about 5 million years | 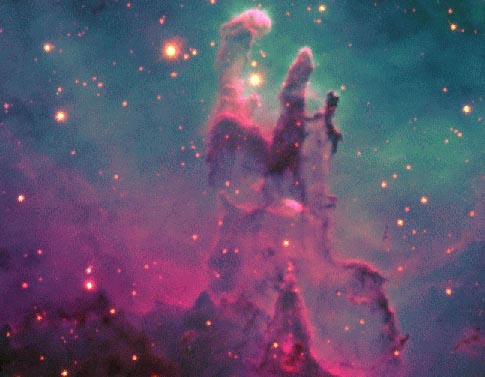 Credit: P. Challis (CfA), Whipple Obs., 1.2 m Telescope |
| The Eagle's EGGs: evaporating gaseous globules (EGGs). Very dense parts of the Eagle contract to form new stars which promptly blow away the surrounding dust and illuminate the columns | 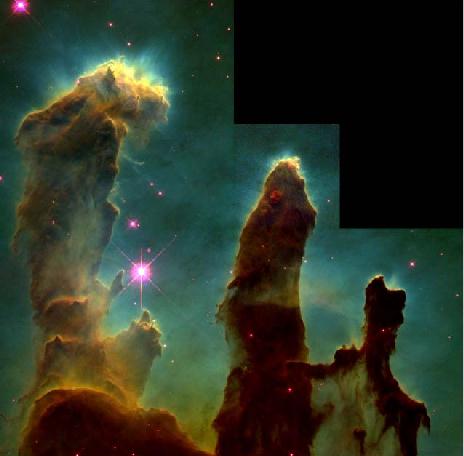 Credit: J. Hester, P. Scowen (ASU), HST, NASA |
| Henize 206: Another star forming region in the Large Magellanic Cloud. Can see left over remnants of old supernova at the top, which compressed the gas and triggered the star formation | 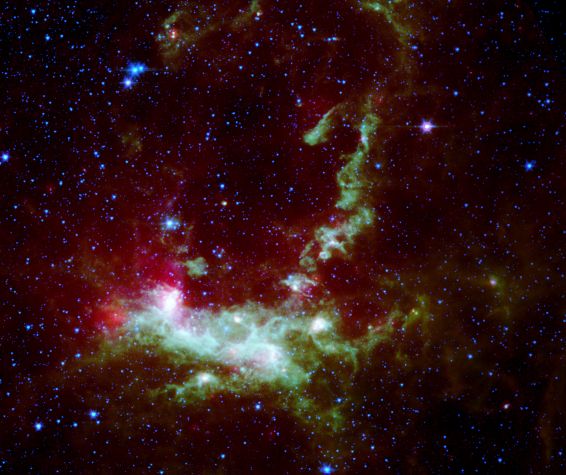 Credit: V. Gorjian(JPL) et al., JPL, Caltech, NASA |
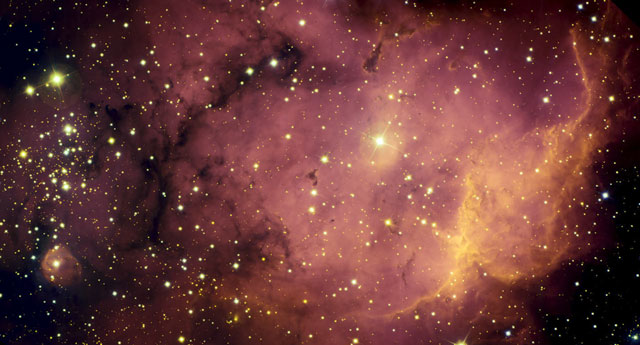
| N81: a group of very young hot stars in the Small Magellanic Cloud heating up the nebula round them | 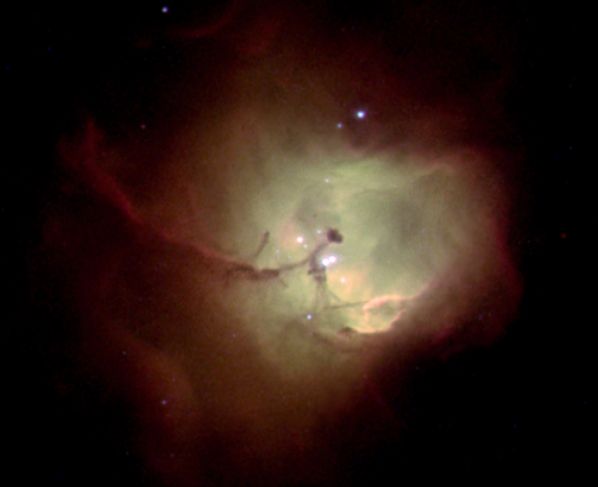
Credit: M. Heydari-Malayeri (Paris Obs.) et al., Hubble Heritage Team, NASA |
| XZ Tauri consists of 2 very young unstable stars, separated by about Sun-Pluto distance, emitting vast cloud of gas (pictures taken over 5 years) | 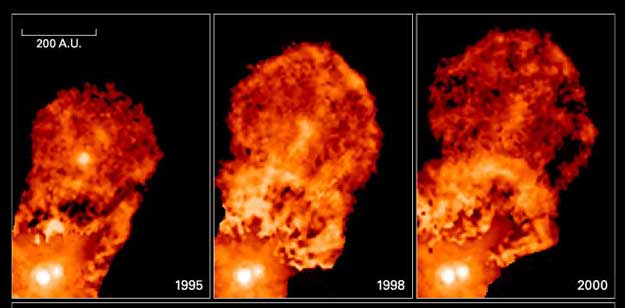 Credit: John Krist (STScI) et al., WFPC2, HST, NASA |
Means......
Mass is the critical factor for "normal" stars: the other important parameter is density: For comparison
When a star as big as the sun reaches the end of its life, it turns into a planetary nebula: outer 1/3 of star is blown away, leaving very hot core as a white dwarf
The classic example is M57: The Ring Nebula
|
 Credit: H. Bond et al., Hubble Heritage Team (STScI /AURA), NASA |
| The star blows away its outer layers, so almost all the older ones we knew look like this. | 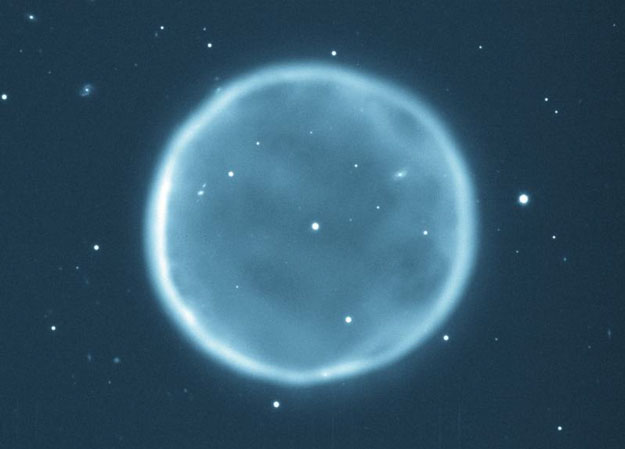 |
| Mz3: The Ant Nebula. Probably magnetic field is creating a "focussed" planetary nebula | 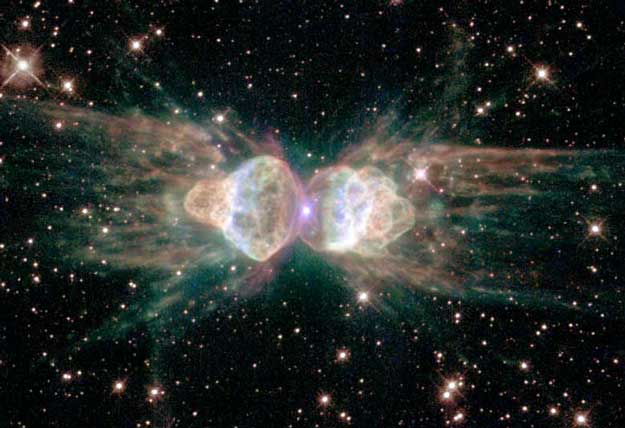 Credit: R. Sahai (JPL) et al., Hubble Heritage Team, ESA, NASA |
Density: ∼ 1011: ∼ 100,000 times as dense as lead.
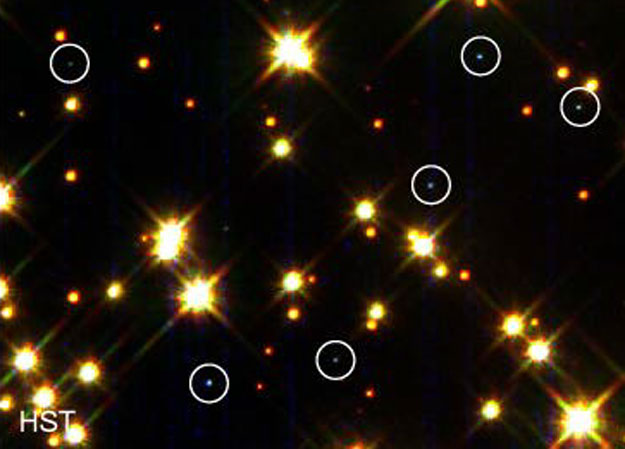
| This shows some in M4 (a rich globular cluster of stars). temperature very hot: T ∼ 50000°C: since they are small, they cool very slowly. |
 Credit: NASA, HST, WFPC 2, H. Richer (UBC) |
e.g. Sirius B: probably the best studied;
"Found" by Herschel who noticed Sirius was "wobbling". Observed in 1862 by Alvan Clark: very hard to see since it is close to Sirius A but 1/10000 of the brightness
This implies a very small object:
|
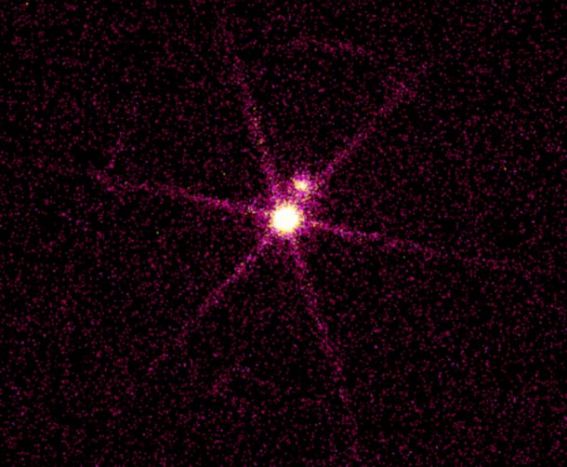 |
Note: Both Greek and Chinese records describe Sirius as red: it may have changed in historical times.
| What Sirius might have looked like: NGC 3132 (the Eight Burst Nebula), a recently formed planetary nebula with a white dwarf and companion, will probably look like Sirius in 100000 years | 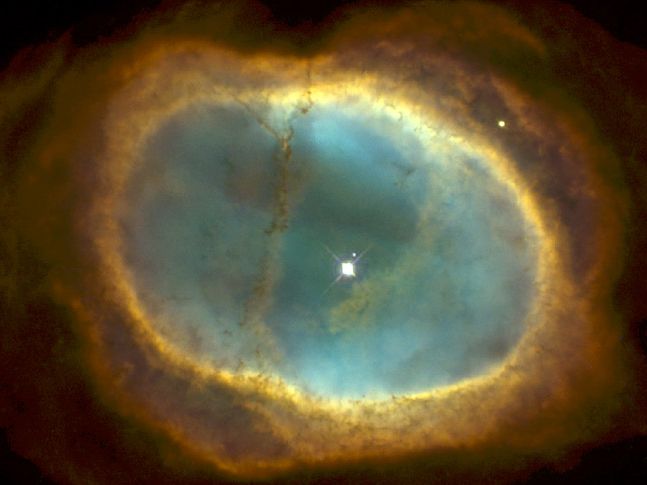 Credit: Hubble Heritage Team (AURA/STScI /NASA) |
Predicts maximum mass of WD is ∼ 1.4Mo
Approx 1/30 yr known in Milky Way
6 visible in recorded history
SN 1006: History's Brightest Supernova. Composite view
|
 |
| THis shows remnants of the expanding shockwave |  Credit: Frank Winkler (Middlebury College) et al., AURA, NOAO, NSF |
| 1054 Type I Crab. Two superimposed pictures show how it is still expanding |  |
| Visible July 4th. m ∼-6: Chinese records as visible in daylight for 23 days , about 2 years at night. May have been recorded in an Anasazi cliff painting, but not in Europe (why?) | 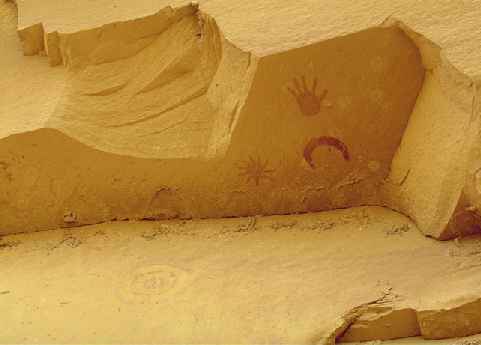 |
| Composite picture shows detailed structure + X-rays | 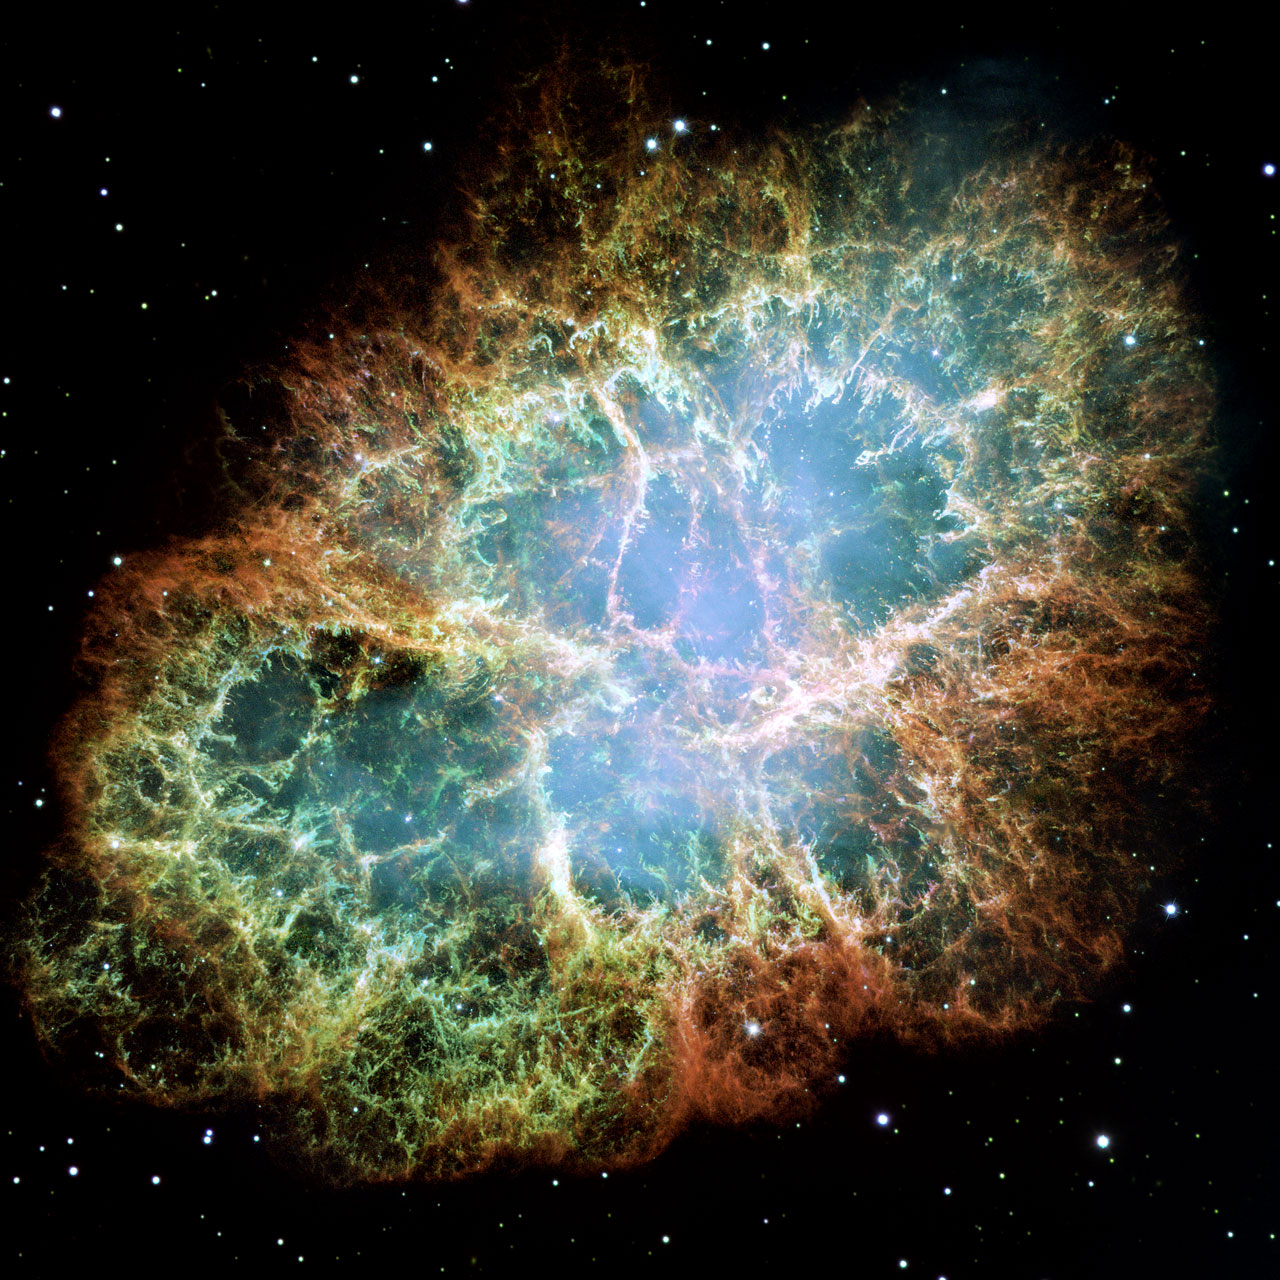 |
| 1181 Type II. Now seen as radio source 3C58. THis is in X-rays | 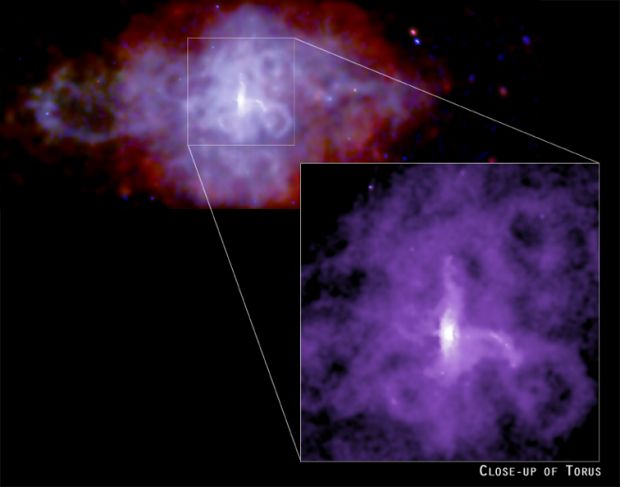
Credit: P. Slane (Harvard-Smithsonian CfA) et al., CXC, NASA |
| 1572 Type I Tycho Gas is still very hot, so produces X-rays,seen in blue at front of blast wave | 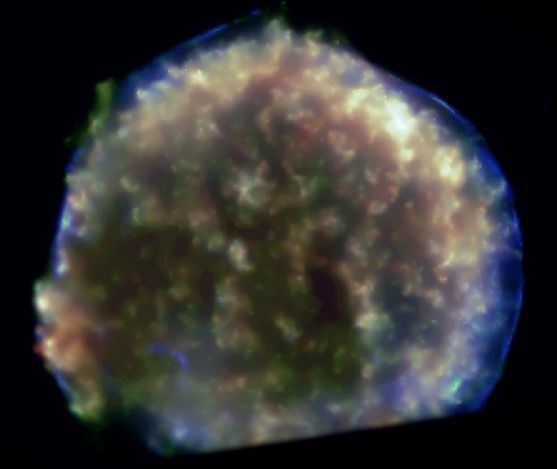 Credit: SAO, CXC, NASA Credit: SAO, CXC, NASA
|
| 1604 Type I Kepler. Temps still in excess of 1000000°C | 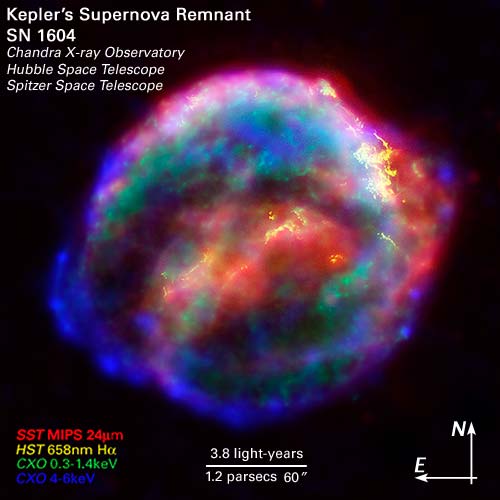
Kepler's SNR from Chandra, Hubble, and Spitzer Credit: R. Sankrit and W. Blair (JHU) et al., ESA, NASA Graphic: courtesy STScI |
| 1667 Type II Cas.A | 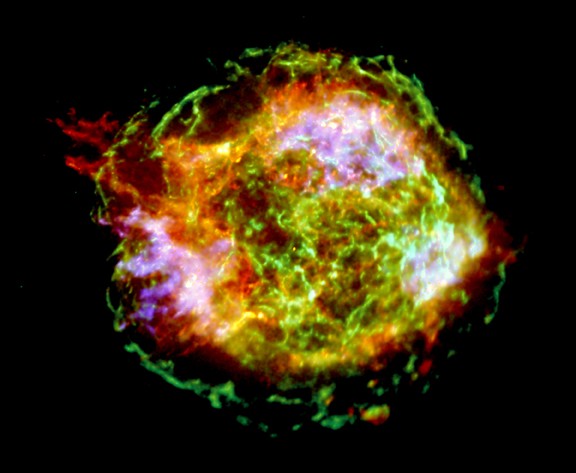 Credit: U. Hwang (GSFC/UMD), J.M. Lamming (NRL), et al., CXC, NASA, |
2 Kinds, distinguished by light curves
TYPE IDecay rapidly for 30 days, exponentially afterwardsIn all galaxies TYPE IIRapid decay -> Plateau->Rapid decay |
 |
Type 1 have a compact object (white dwarf) with a red giant, which expands and spills material onto companion, finally triggering catastrophic collapse. All type 1a seem to be the same (very important for later on!)
|
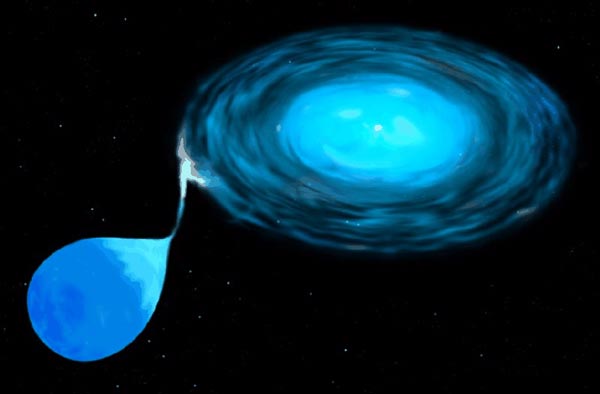 Drawing Credit: ST ScI, NASA |
Pre-collapse: \color{red}{\rho \sim 10^9 ,T_C > 10^9 K} �
| Supernova 2005cs in M51 (see center of right image). Blue supergiant, type II. Discovered by Wolfgang Kloehr, June 28, 2005 |  |
We have now seen all the stages in the stellar evolution of both small and larger stars: they can now be fitted into a life-cycle:
| Times are approximate in years. |  |
Endpoint depends on mass of star: Note lifetimes are much shorter. |
 |
| In HR terms: | 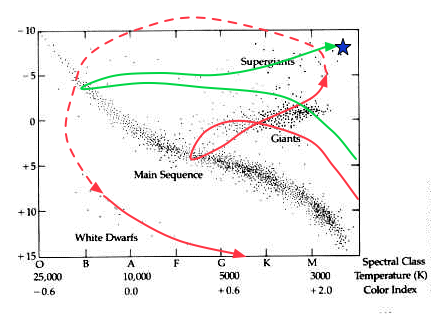 |