Analysis 7 of GEM position resolution

Dean Karlen / March 12, 2001

This document summarizes the analysis of the GEM data taken in early March 2001, in which the 2.5 mm strips were used as the readout structure. Several improvements to the readout electronics have been made to reduce cross talk effects.
 

Index


GEM pad layout

The figure linked here shows the GEM strip layout and coordinate system used in the analysis. The coordinate system (shown in blue) is centred between strips 3 and 5. The strips are numbered from 1-3 and 5-7, according to the readout channel. (Not to be confused with the GEM-strip number 1-10). A sum of all strip signals is read out by both oscilloscopes (channels 4 and 8), to provide a common trigger.

GEM data

The data sets taken in early March were taken with P10 gas with Vdrift = 3475V, Vgem=3375, using the ALEPH preamplifier, and the xray tube set at 6 kV. The sampling rate was 125 MHz for runs 101-205 and 250 MHz for runs 601-704.

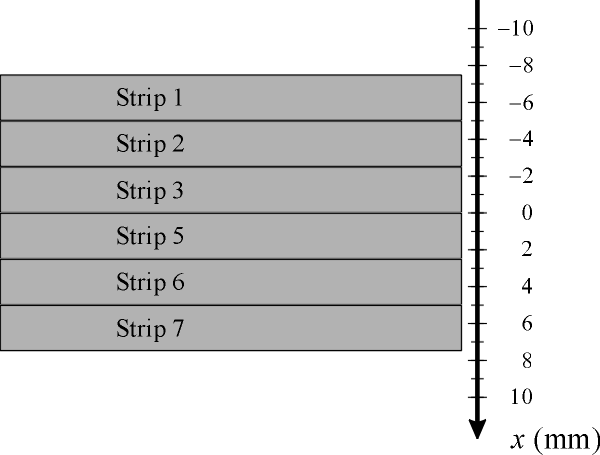
The data runs are summarized below. The collimator location is indicated using the coordinate system described above(ie. with respect to x=0 located on edge between channels 3 and 5). The first digit of the run number is the day of the month that the data was taken. Non-coincident triggers of the scopes resulted in the loss of only 10-20 events per run for most runs (much improved from analysis 6 data). The second last column indicates the GEM-strip number (1-10) that corresponds to the strip number 1 in this analysis, and the last column indicates the GEM-strip number for those events where the pinhole was centred on a strip.

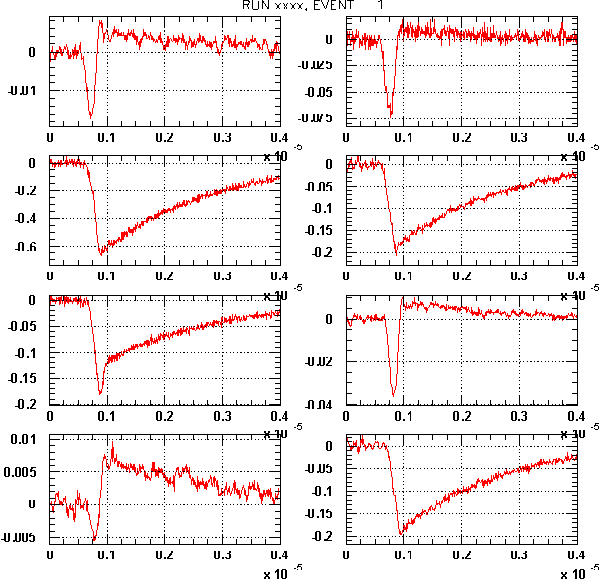
As an example, an event from run 104 is shown here. The far away strips have very small induced pulses. There is less noise than in the analysis 6 data. The problematic crosstalk (order 5-10mV) seen in distant strips (and presumably present on all strips) is still present in the data. The amplitude of these signals is correlated with the total charge signal observed. It is interesting to note that the amplitude is approximately the same in all strips, independant of its distance from the signal strip. When the pinhole is centred over a strip, a small amount of charge is collected by the neighbouring strips, that partially cancels out the positive crosstalk signal.

 
run number
x_coll (mm)
events
GEM-strip offset
GEM-strip centre
101
-1.25
483
5
7
102
-1.00
487
5
103
-0.75
484
5
104
-0.50
489
5
105
-0.25
490
5
106
  0.00
486
5
107
  0.06
482
5
108
  1.25
489
4
7
109
  1.00
480
4
201
  0.75
487
4
202
  0.50
476
4
203
  0.25
478
4
204
  0.00
490
4
205
  -0.02
489
4
601
  -6.25
323
1
1
602
  -3.75
481
1
2
603
  -1.25
476
1
3
604
  1.25
281
1
4
701
  -1.25
112
3
5
702
  1.25
483
3
6
703
  -1.25
483
5
7
704
  1.25
488
5
8

GEM data analysis programs

The results shown below come from the gemanal program (version 1.0) located in the directory /home/karlen/gem. An associated paw kumac file, gems.kumac (note: new filename), is found in the same area.

Separation of direct and induced components of signals

As in the previous analyses, the direct charge component of a signal is deduced from the amplitude measured a fixed time after the peak (referred to as the "late" amplitude). In this analysis the delay is chosen to be 600 ns, for runs 101-205 and 300 ns for runs 601-704. (Due to different sampling rates for the datasets).

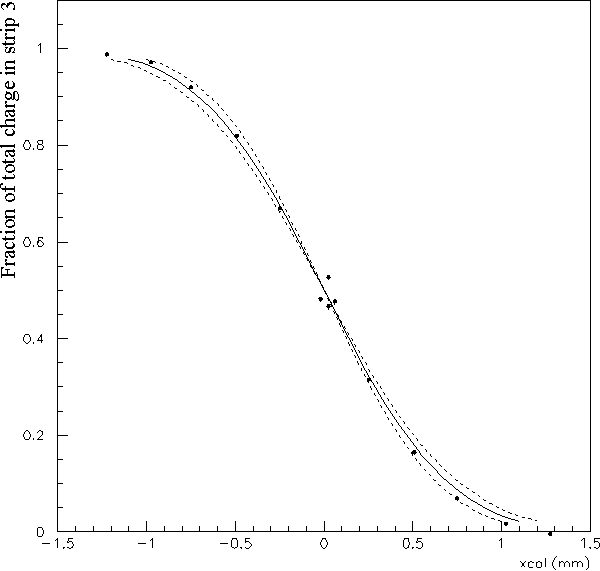
The scaling factor for all pads is taken to be 0.44 for runs 101-205 and 0.71 for runs 601-704.

Gain variation

The gain of the system shows some variation over these runs, as can be seen in the figure linked here. The plots show the total charge collected by all strips, as deduced by the "late" amplitude and scaled by the factor from the previous section. This figure now shows results are from a Gaussian fit, and the uncertainty in the mean is shown by error bars (often too small). Prior tests of gain uniformity where simply based on the mean, but with the new triggering scheme, many more cosmics are triggered and the mean is no longer a good measure of the gain. The present operation does not have good long term gain stability, as can be seen by comparing runs 101, 108 and 703 (all with the pinhole the centered over same GEM-strip 7).

Pedestals

The data for each channel is corrected by using a pedestal defined by the average of measurements before the pulse (time bins 10-60).

Position analysis from direct charge sharing

Observed charge fraction in pad 1 - determination of cloud size
The figure linked here shows the observed charge fraction in strip 3, as a function of the x-coordinate of the collimator. The curves represent the expected charge fraction for the simple Gaussian model with 550 microns (solid line) and 500 and 600 microns (dashed lines) cloud sizes. In order to get reasonable agreement, the total charge is scaled by 0.95 to account for the approximately 1% false negative-charge that result from the cross talk overshoot in all channels.
Determining position from charge fractions
As in analysis 6, the position resolution that can be acheived is estimated from the standard deviations of the charge fractions are determined for each run, and are shown in the figure linked here. The standard deviations for the charge fraction in the central part of the strip is about 0.015 and for measurements near the edges is 0.043. The standard deviations for the central part is smaller than was seen in analysis 6 (0.026), likely a result of reduced noise in the readout system. The standard deviations near the edges is unchanged, as expected, since it was assumed that this was due to centroid movement, which has not changed.

Position analysis from induced pulses

To determine the x-coordinate from induced pulses, the same approach can be used as for the hexagonal pad analysis. Since there is only one coordinate, the procedure is simplified.

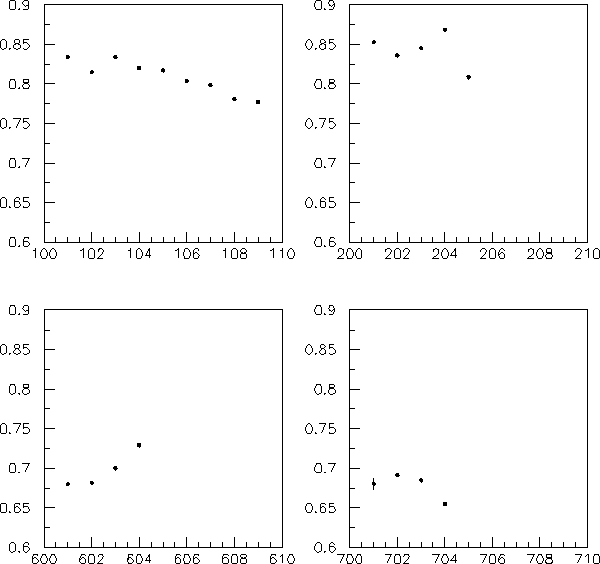
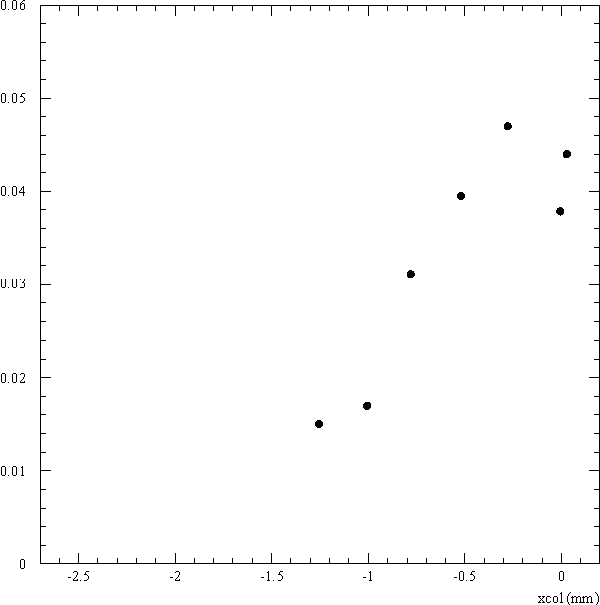
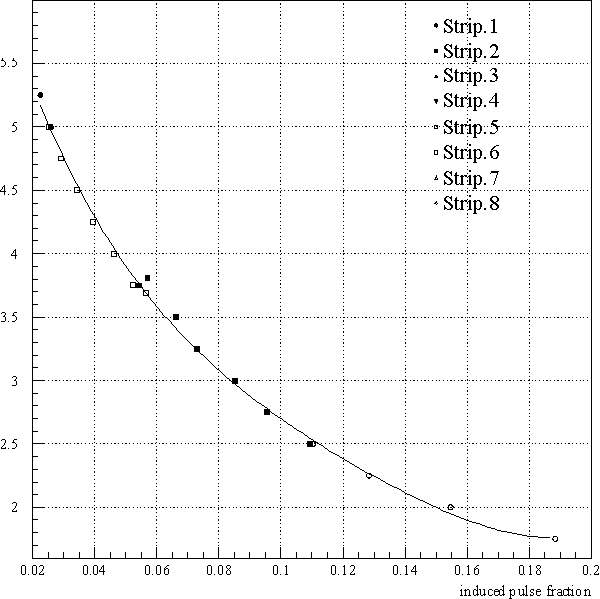
The ratio of the peak amplitude of the induced pulse to the total charge of the event as a function of distance to the strip centre is shown in the figure linked here. No modification of the strip gains were applied to bring the measurements into agreement. In analysis 6, corrections of 5-8% were necessary.

Conclusion

The data taken in early March, 2001 has improved characteristics compared to analysis 6: reduced noise and equality of strip gains. The problematic cross talk (positive signals of order 10 mV) are still present.
© 2006 Carleton University 1125 Colonel By Drive, Ottawa, Ontario, K1S 5B6 Canada (613) 520-7400
| Contacts |
Canada's Capital University